Fig. A.2
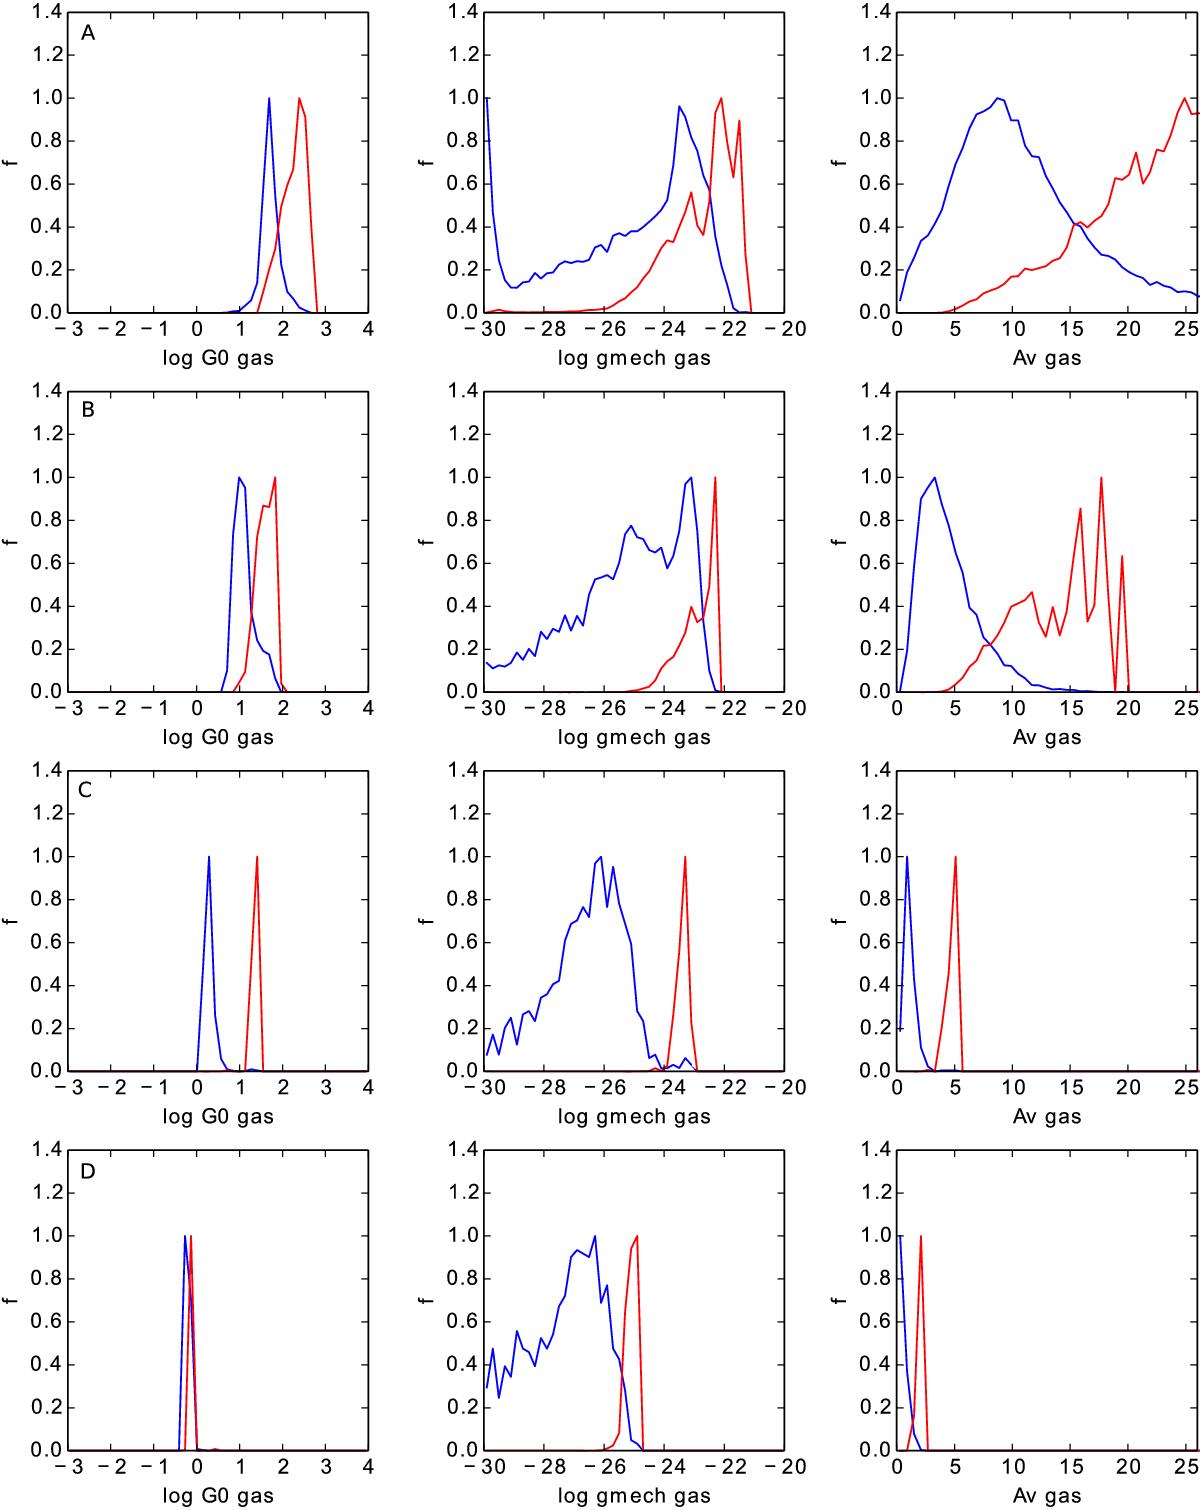
Distribution functions as a function of G0, Γmech and AV for the representative pixels labeled A, B, C and D of Fig. 8. The blue curves represent the distributions as a function of G0 (first column), Γmech (second column) and AV (third column). The red curves represent the fractional contribution of these distributions to the luminosity of their corresponding pixels. Both curves are normalized to their peak so that we can visually compare the subset of these distributions which contribute to the luminosity.
Current usage metrics show cumulative count of Article Views (full-text article views including HTML views, PDF and ePub downloads, according to the available data) and Abstracts Views on Vision4Press platform.
Data correspond to usage on the plateform after 2015. The current usage metrics is available 48-96 hours after online publication and is updated daily on week days.
Initial download of the metrics may take a while.