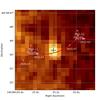
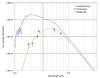
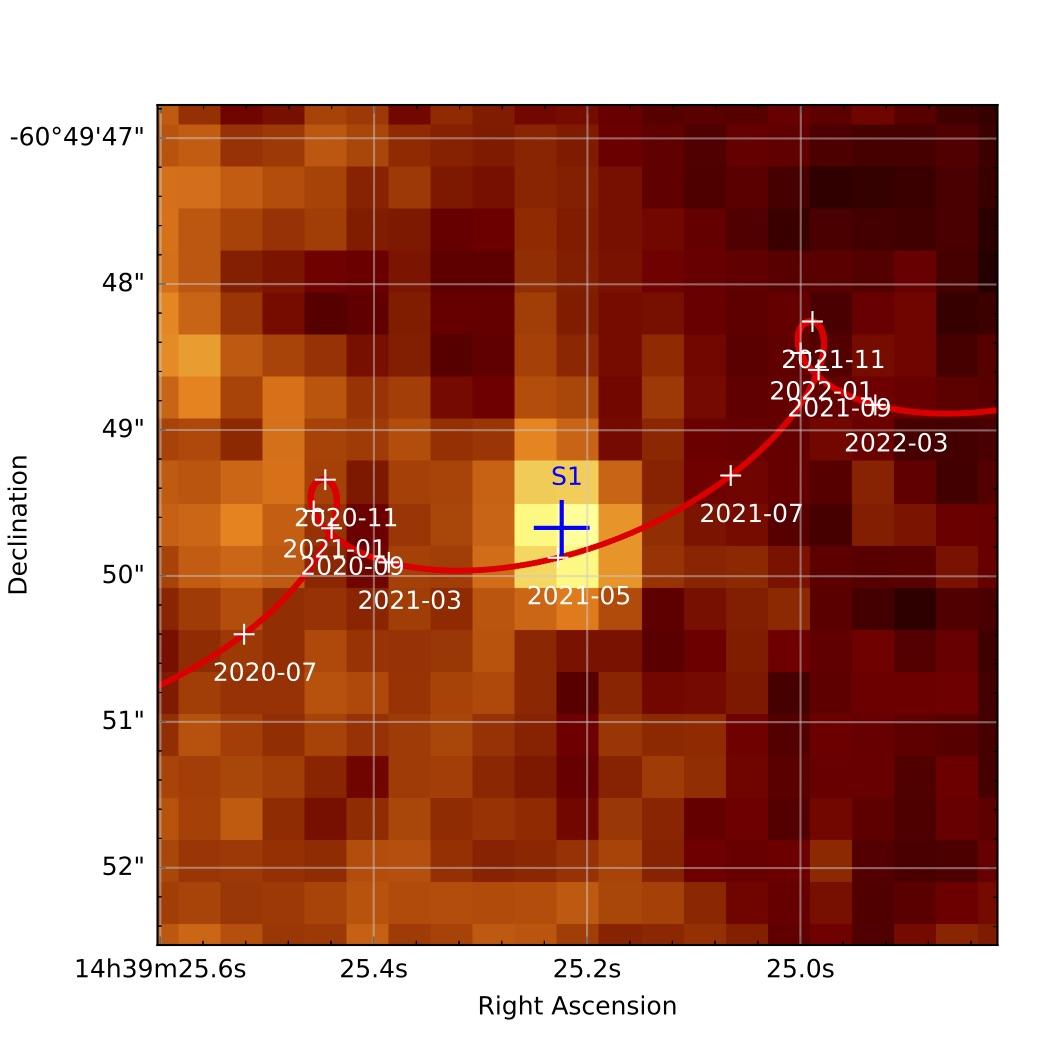
Fig. C.1

Left panel: trajectory of α Cen B relative to S1 (red curve) on the SOFI image obtained on 25 February 2009. The uncertainty on the impact parameter is represented with blue segments crossing at S1’s position. Right panel: photometry of S1 (red dots) compared to a Kurucz SED model of a θLD = 0.012 mas star with Teff = 4500 K (blue curve) and E(B−V) = 1.6 (green curve).
Current usage metrics show cumulative count of Article Views (full-text article views including HTML views, PDF and ePub downloads, according to the available data) and Abstracts Views on Vision4Press platform.
Data correspond to usage on the plateform after 2015. The current usage metrics is available 48-96 hours after online publication and is updated daily on week days.
Initial download of the metrics may take a while.