Fig. 3
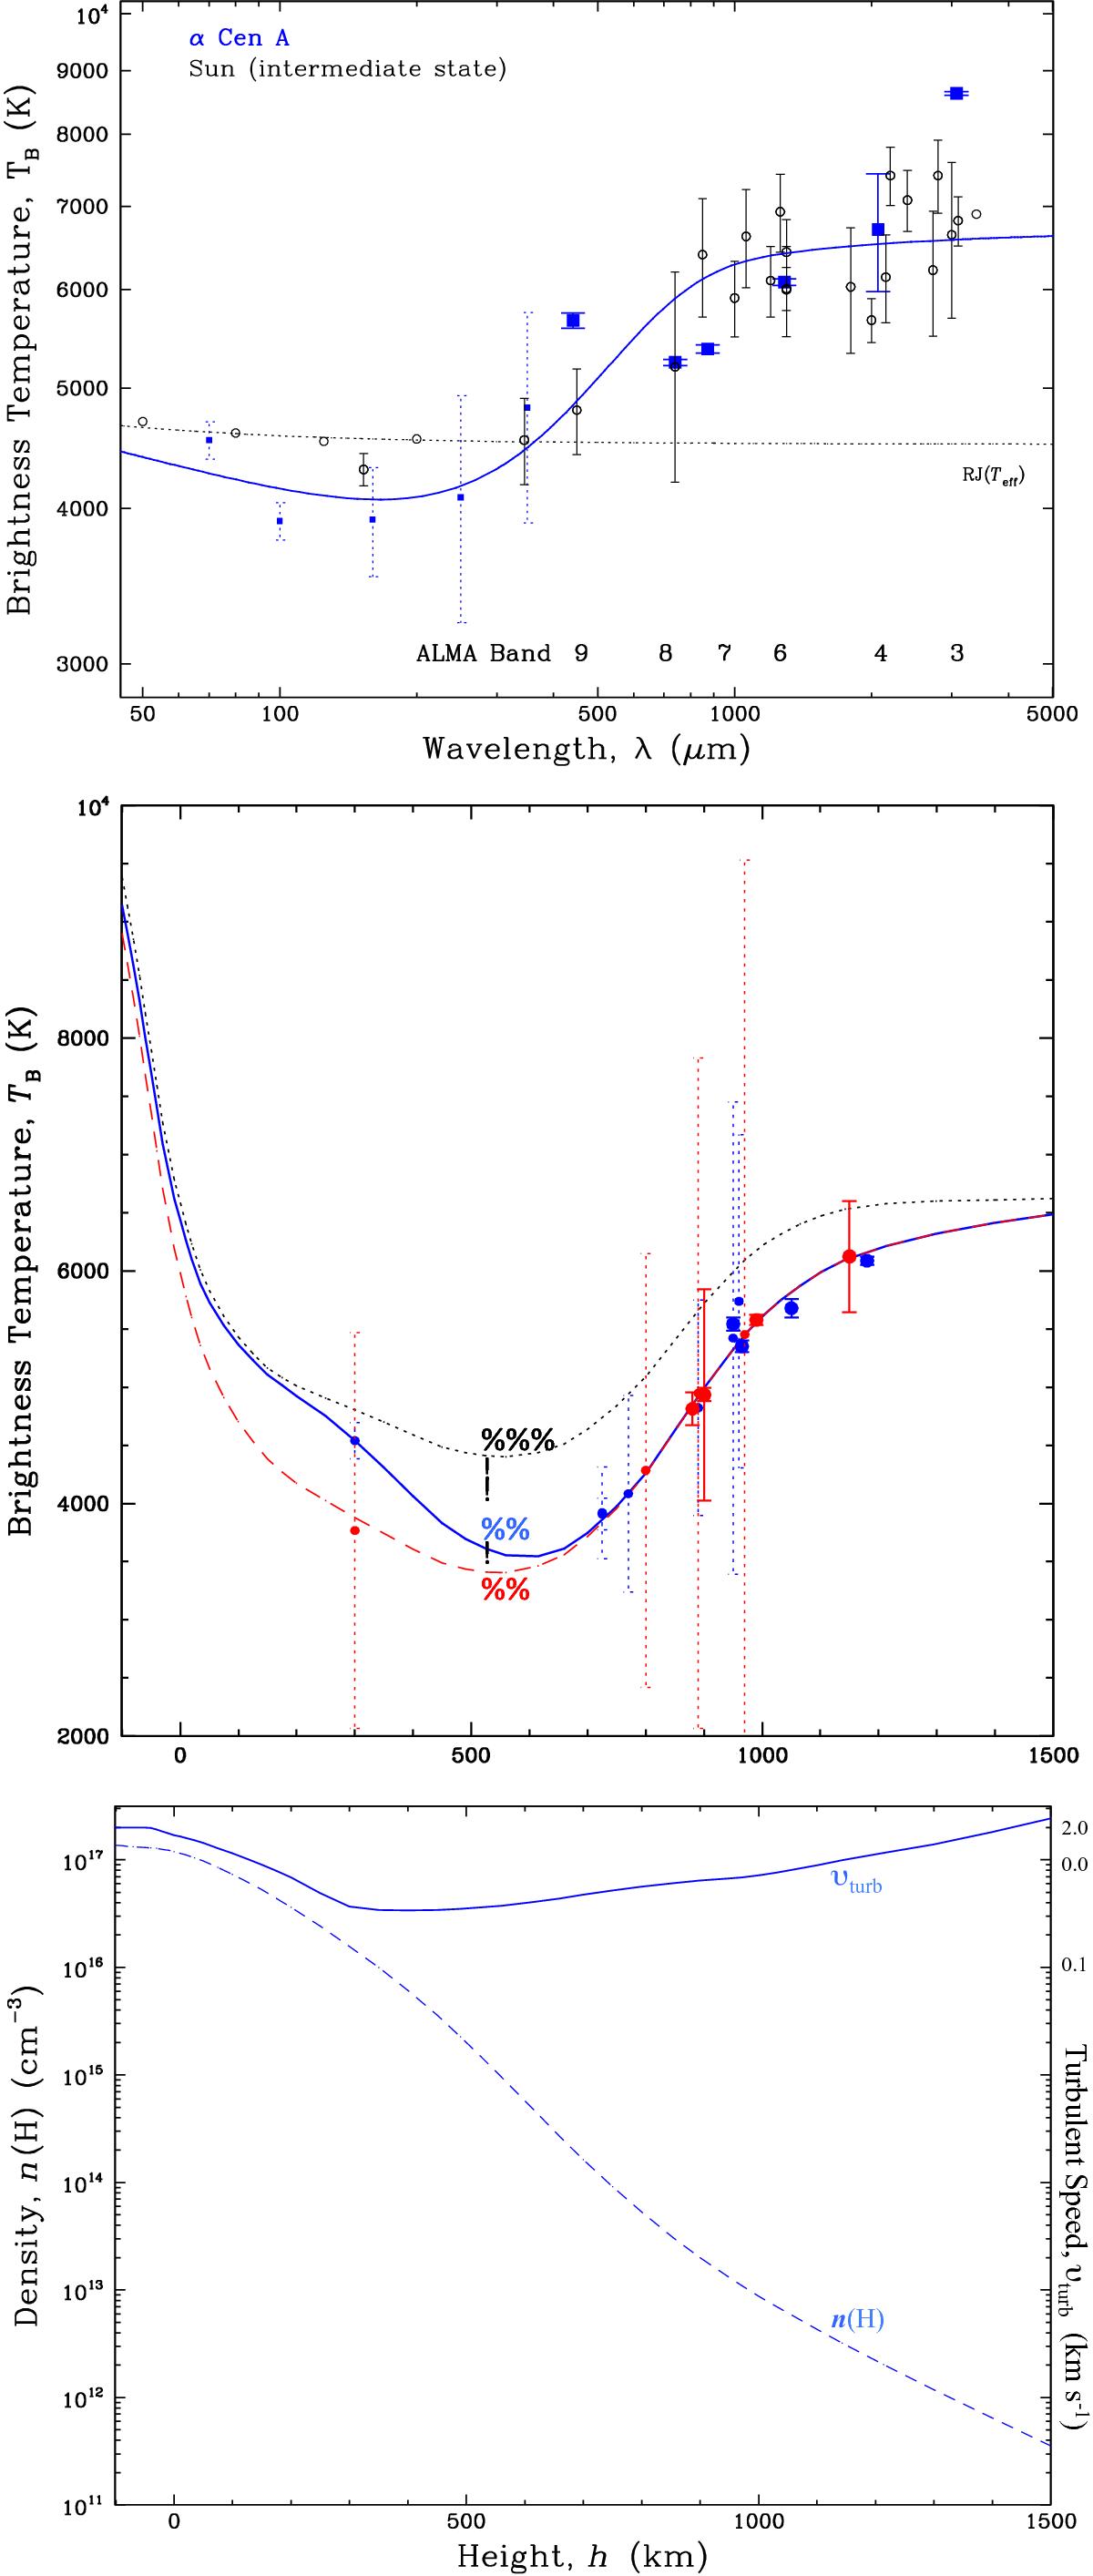
Top: SED of the model chromosphere of the G2 star α Cen A, based on the modified solar C 7 model, is shown with the blue curve. Data are from Spitzer, Herschel, and APEX (Liseau et al. 2013) (small blue symbols and dotted error bars) and from ALMA (big blue squares). The ALMA bands are indicated at the bottom of the figure and the stellar photosphere is shown as RJ(Teff). For comparison, data for the quiet Sun from Loukitcheva et al. (2004) are shown as black open circles. Middle: run of TB with height h with symbols as above. For comparison, also the corresponding model for the K 1 star α Cen B is shown in red, and, for reference, the solar C 7 model as black dots. Bottom: run of density n(H) and turbulent velocity υturb with height h is shown for the solar analog α Cen A.
Current usage metrics show cumulative count of Article Views (full-text article views including HTML views, PDF and ePub downloads, according to the available data) and Abstracts Views on Vision4Press platform.
Data correspond to usage on the plateform after 2015. The current usage metrics is available 48-96 hours after online publication and is updated daily on week days.
Initial download of the metrics may take a while.