Fig. 2
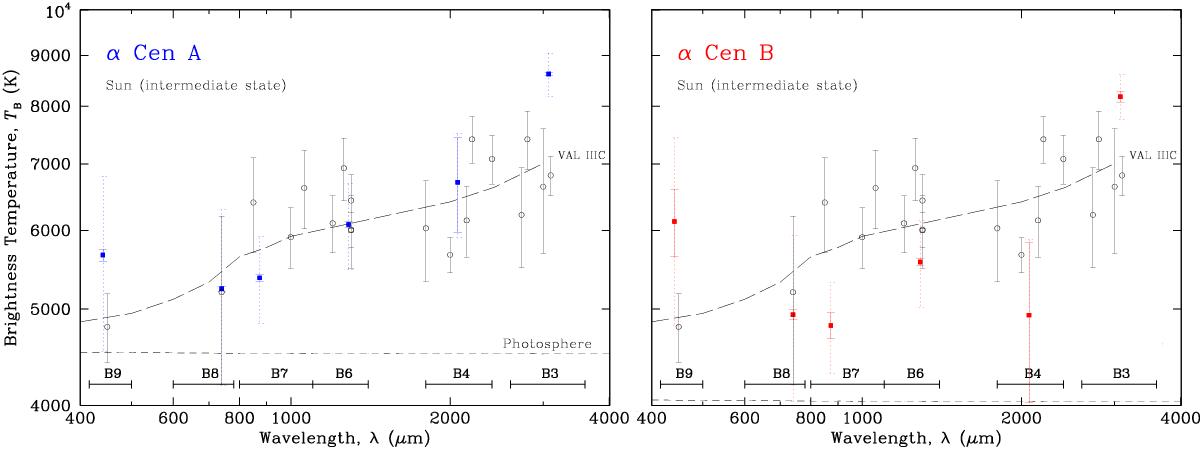
Brightness temperature TB in Kelvin at ALMA wavelengths λ in μm, for Bands 3 to 9 of the G-star α Cen A (left, blue) and the K-star α Cen B (right, red). In addition to the observational rms errors (solid bars), the estimated absolute errors, including calibration uncertaities, are shown as dashed error bars. The stellar photospheres, represented by extrapolations to PHOENIX model atmospheres of Brott & Hauschildt (2005) for the respective stars (Teff, log g, [Fe/H]), and shown as black dashed lines. The ALMA bands are indicated below. A solar model chromosphere (VAL IIIC, Vernazza et al. 1981) is shown as long dashes, with data for the Sun from Loukitcheva et al. (2004) as black open circles.
Current usage metrics show cumulative count of Article Views (full-text article views including HTML views, PDF and ePub downloads, according to the available data) and Abstracts Views on Vision4Press platform.
Data correspond to usage on the plateform after 2015. The current usage metrics is available 48-96 hours after online publication and is updated daily on week days.
Initial download of the metrics may take a while.