Fig. 1
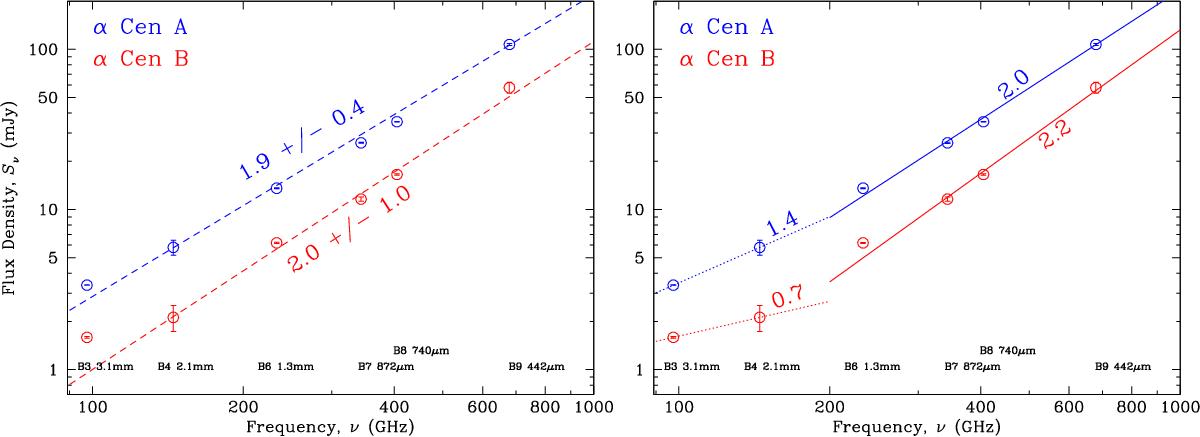
Measurements of the flux density of α Cen A (blue circles) and α Cen B (red circles) with ALMA, with statistical 1σ error bars inside the symbols. Left: assuming that Sν ∝ να, least-square fits to the Bands 3 to 9 flux densities are shown with dashed lines with the power-law exponent α = dlog Sν/ dlog ν shown next to them. Right: fits are shown with solid lines, performed as in the left panel, to the data above, and with dotted lines below 200 GHz (~1.5 mm). The ALMA bands, with their central wavelengths, are identified at the bottom of the figure.
Current usage metrics show cumulative count of Article Views (full-text article views including HTML views, PDF and ePub downloads, according to the available data) and Abstracts Views on Vision4Press platform.
Data correspond to usage on the plateform after 2015. The current usage metrics is available 48-96 hours after online publication and is updated daily on week days.
Initial download of the metrics may take a while.