Fig. 8
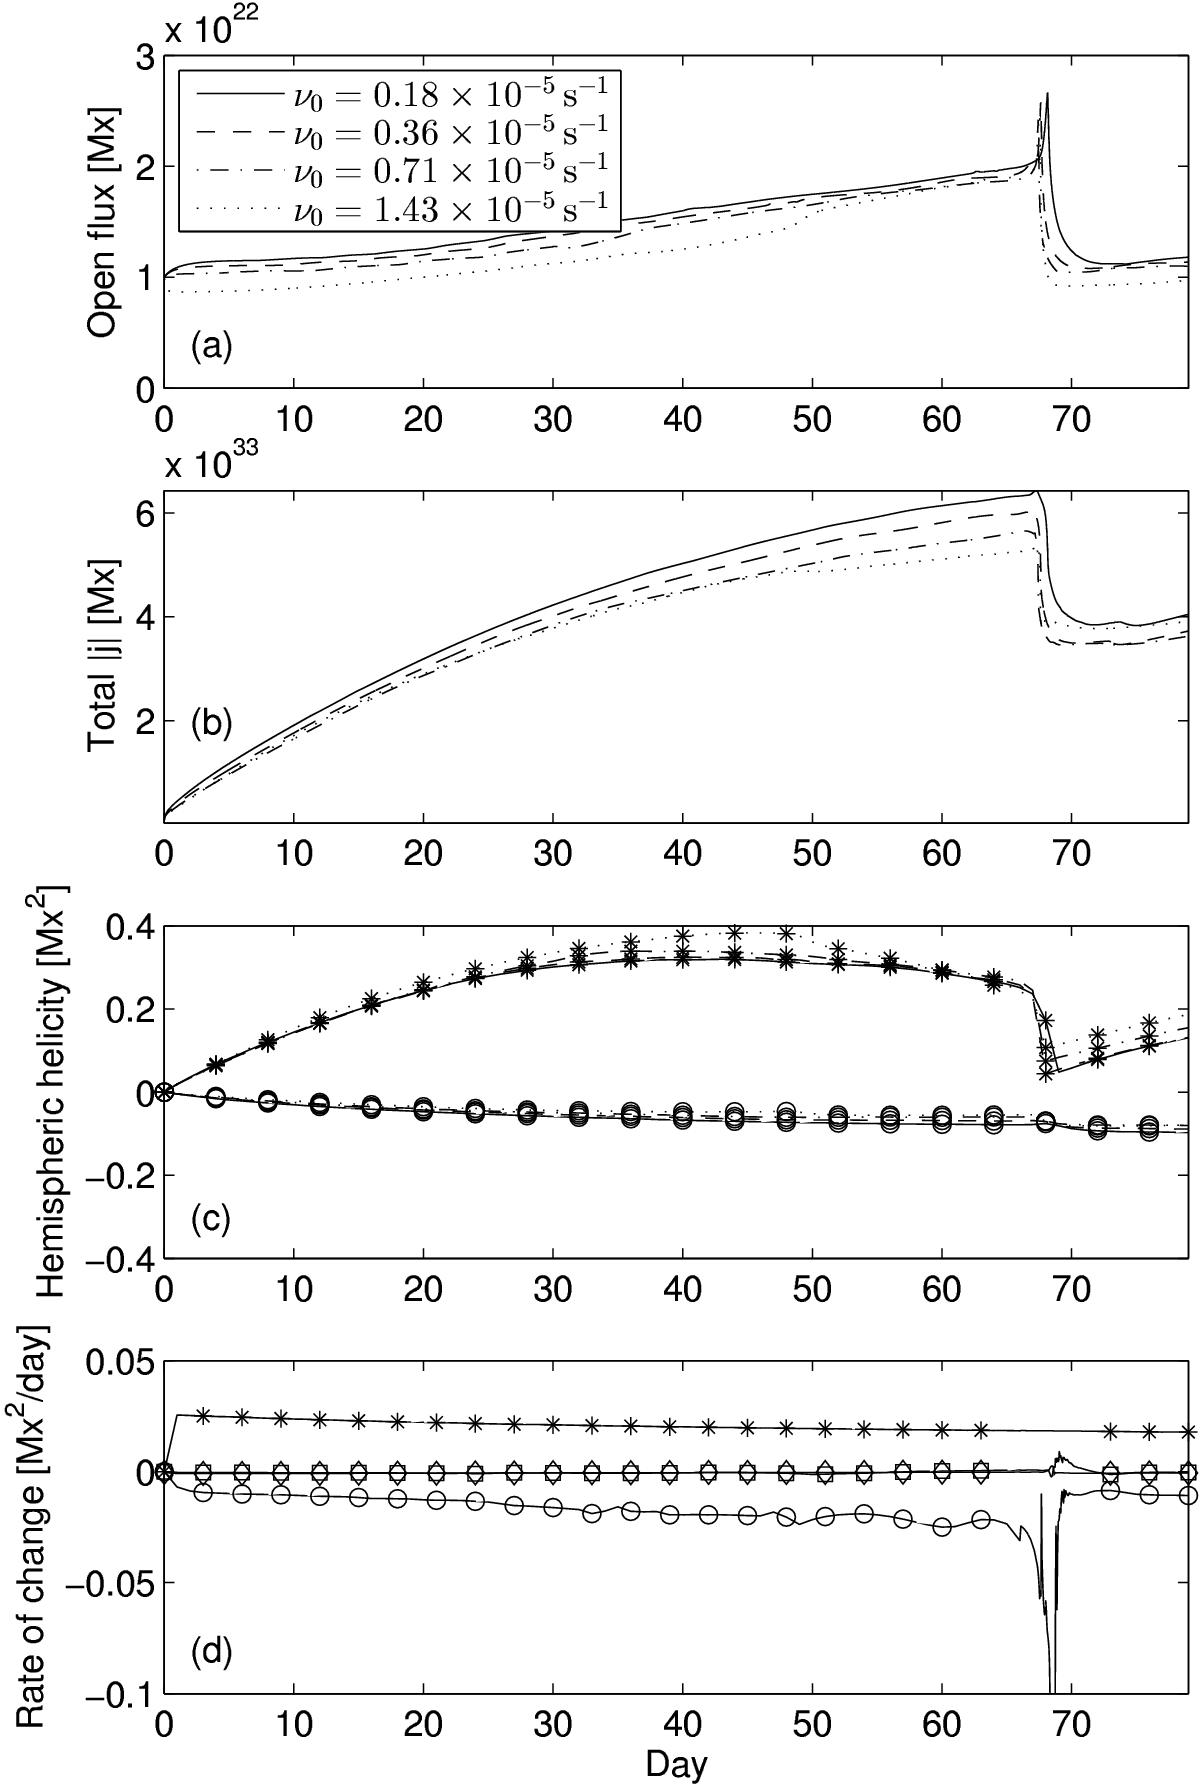
Various integrated quantities as a function of time, for the quadrupolar simulations with different ν0 (indicated by line styles). The format is the same as Fig. 4. For clarity, panel d) shows only the run with ν0 = 0.36 × 10⁻⁵ s-1, and only for the northern hemisphere, although the hemispheres are no longer symmetric. The peak value of S1 during the flux rope eruption is not shown, and is much larger, about − 1.16 Mx2 day-1.
Current usage metrics show cumulative count of Article Views (full-text article views including HTML views, PDF and ePub downloads, according to the available data) and Abstracts Views on Vision4Press platform.
Data correspond to usage on the plateform after 2015. The current usage metrics is available 48-96 hours after online publication and is updated daily on week days.
Initial download of the metrics may take a while.