Fig. 2
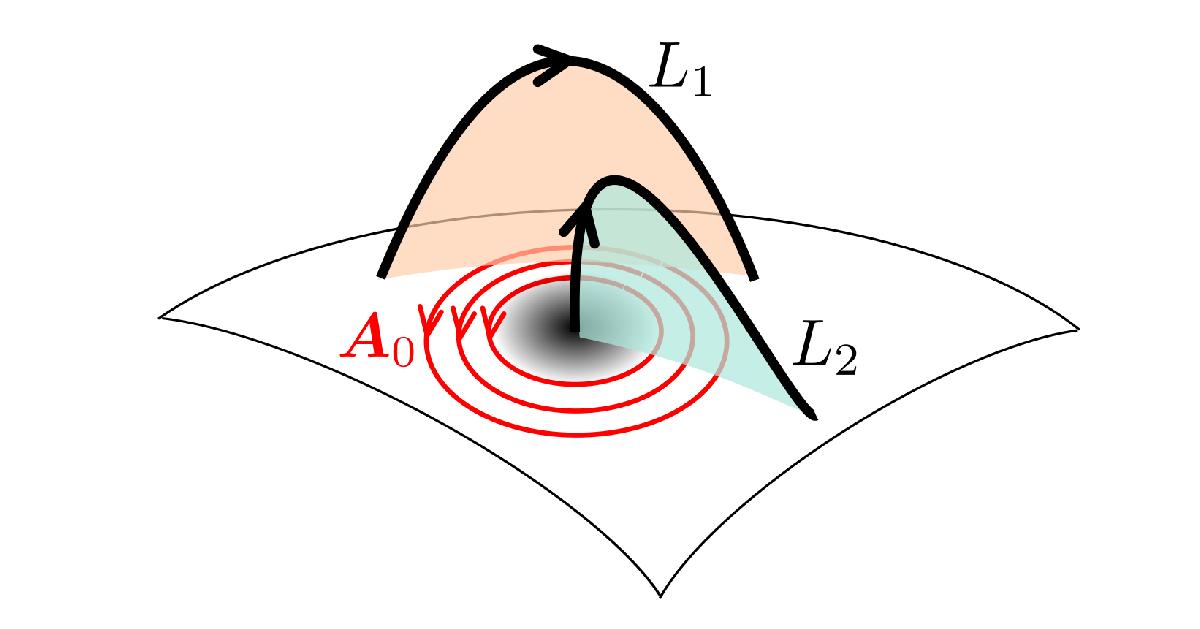
Physical interpretation of field line helicity in the DeVore gauge. The red circles show the direction of A0 (contours of ψ) arising from a strong magnetic source Br> 0. The shaded surfaces are radial projections of the field lines L1 and L2. Both field lines have a contribution to ![]() from any flux linking through these surfaces (owing to the second term of Eq. (4)), but only L1 has a contribution from A0, since the projection of L2 is perpendicular to A0.
from any flux linking through these surfaces (owing to the second term of Eq. (4)), but only L1 has a contribution from A0, since the projection of L2 is perpendicular to A0.
Current usage metrics show cumulative count of Article Views (full-text article views including HTML views, PDF and ePub downloads, according to the available data) and Abstracts Views on Vision4Press platform.
Data correspond to usage on the plateform after 2015. The current usage metrics is available 48-96 hours after online publication and is updated daily on week days.
Initial download of the metrics may take a while.