Fig. 12
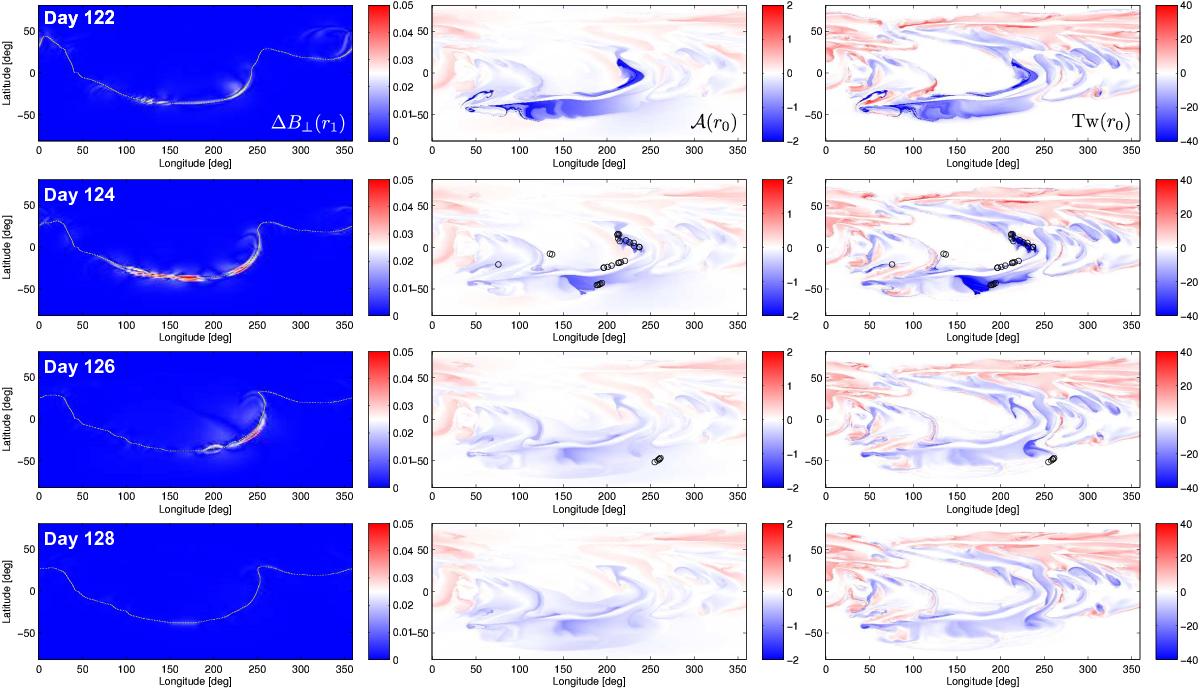
Example of a flux rope ejection from period A. From top to bottom, the rows show days 122, 124, 126, and 128. The left column shows the (absolute) running daily difference of horizontal field ![]() at the outer boundary r = r1. The middle column shows the distribution of
at the outer boundary r = r1. The middle column shows the distribution of ![]() on r = r0 (saturated at ± 2 Mx), and the right column shows the distribution of Tw at r = r0 (saturated at ± 40). The dashed lines in the left column show the neutral line where Br(r1,θ,φ) = 0. Black circles in the other columns identify footpoints of field lines traced down from locations at r = r1 where the running difference of B⊥ exceeds 0.05 G day-1. Animated versions of this figure for both periods A and B are available online.
on r = r0 (saturated at ± 2 Mx), and the right column shows the distribution of Tw at r = r0 (saturated at ± 40). The dashed lines in the left column show the neutral line where Br(r1,θ,φ) = 0. Black circles in the other columns identify footpoints of field lines traced down from locations at r = r1 where the running difference of B⊥ exceeds 0.05 G day-1. Animated versions of this figure for both periods A and B are available online.
Current usage metrics show cumulative count of Article Views (full-text article views including HTML views, PDF and ePub downloads, according to the available data) and Abstracts Views on Vision4Press platform.
Data correspond to usage on the plateform after 2015. The current usage metrics is available 48-96 hours after online publication and is updated daily on week days.
Initial download of the metrics may take a while.