Fig. 11
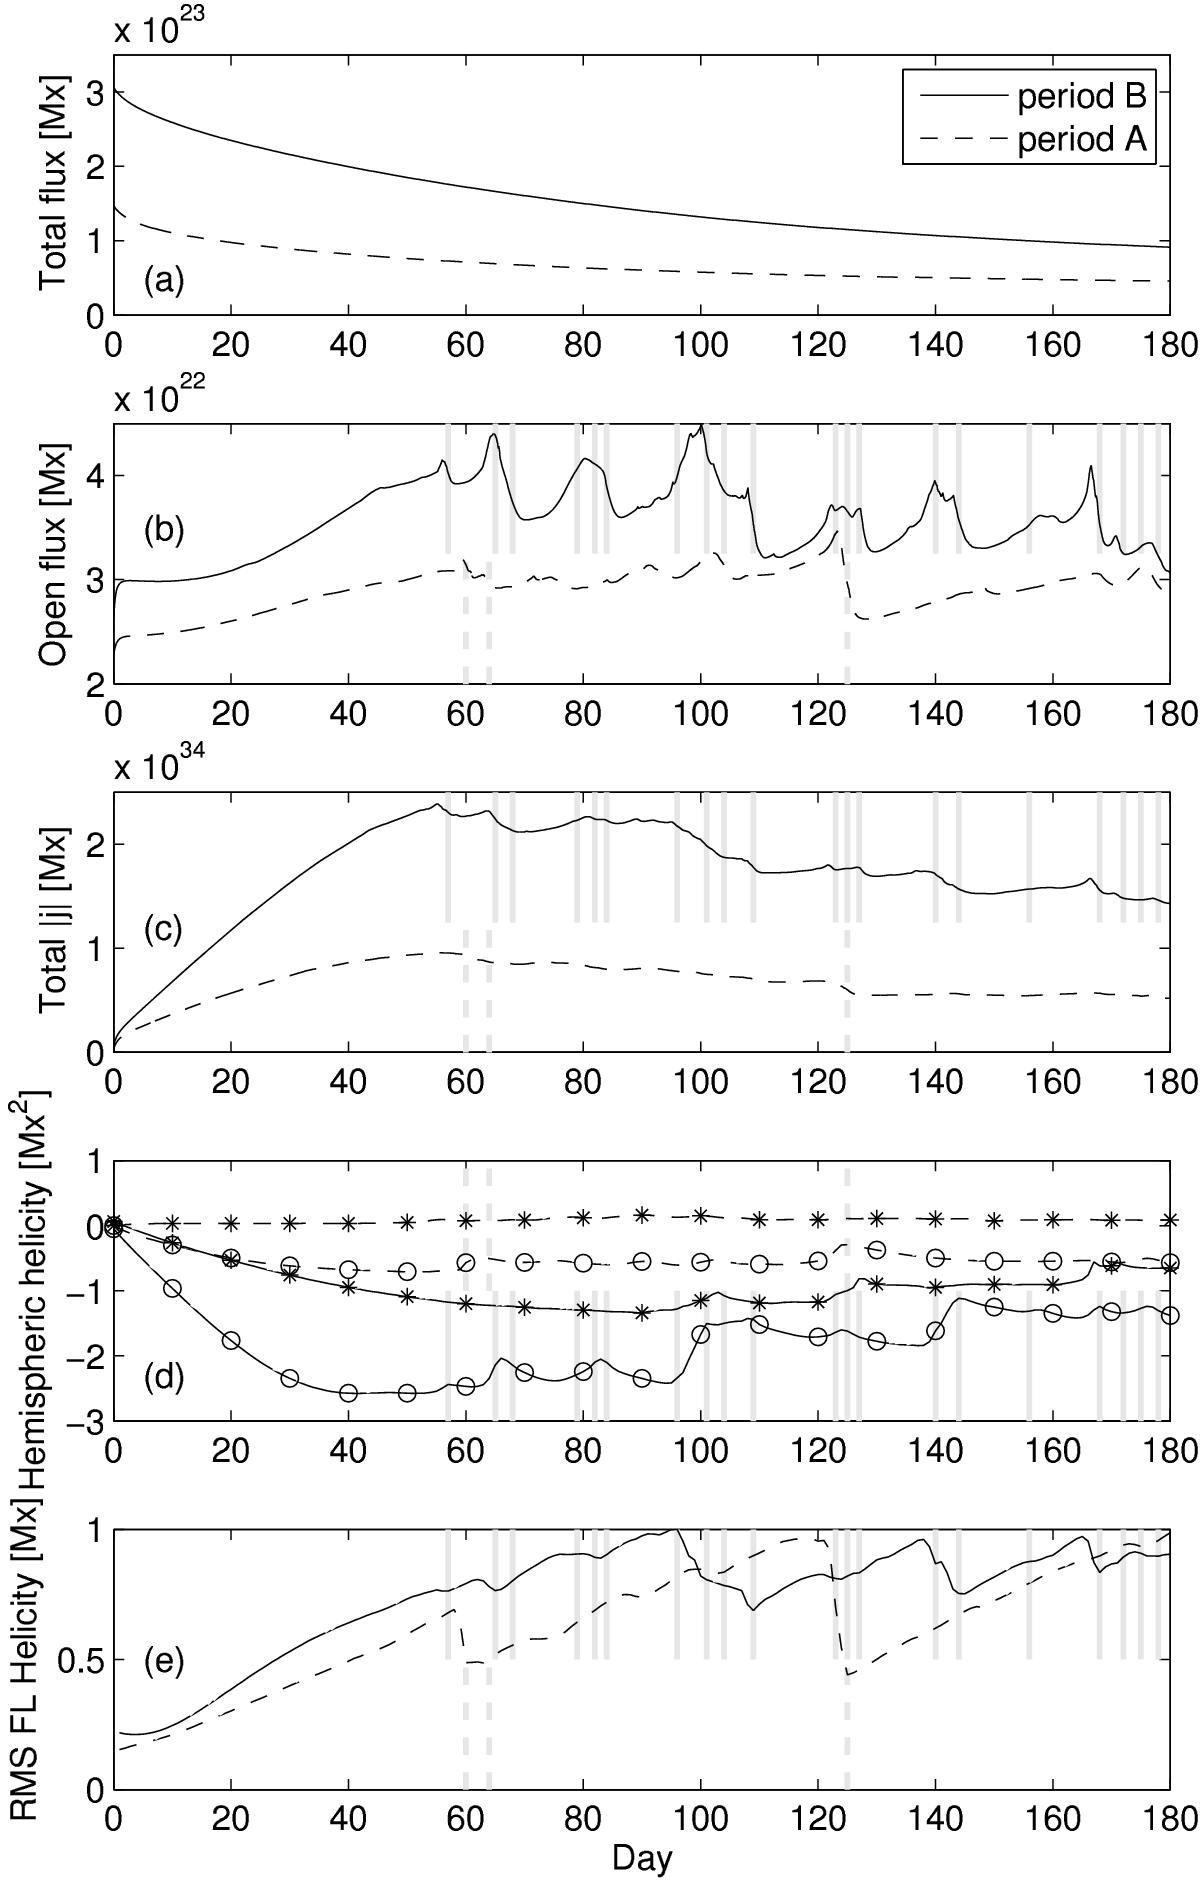
Various integrated quantities as a function of time, for the non-axisymmetric simulations (periods A and B). Panel a) shows the total photospheric magnetic flux ∫r = r0 | Br | dΩ, panel b) shows the total open flux ∫r = r1 | Br | dΩ, panel c) shows ∫D | j | dV, panel d) shows HN (asterisks) and HS (circles), and panel e) shows the root-mean-square field line helicity ![]() . The vertical grey lines indicate times of strong flux rope ejections, as explained in the text.
. The vertical grey lines indicate times of strong flux rope ejections, as explained in the text.
Current usage metrics show cumulative count of Article Views (full-text article views including HTML views, PDF and ePub downloads, according to the available data) and Abstracts Views on Vision4Press platform.
Data correspond to usage on the plateform after 2015. The current usage metrics is available 48-96 hours after online publication and is updated daily on week days.
Initial download of the metrics may take a while.