Fig. 10
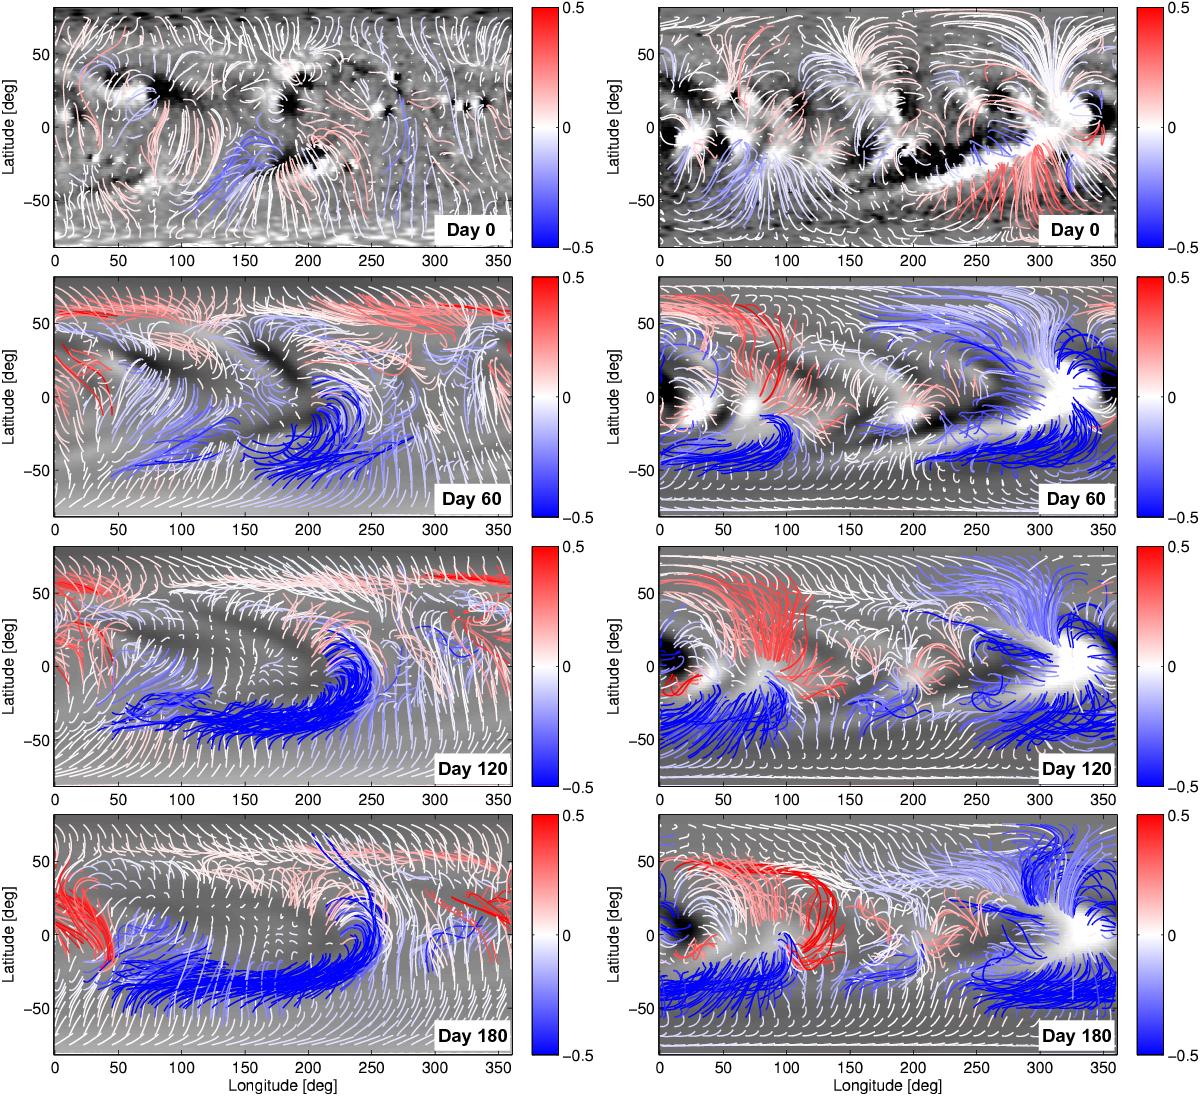
Projected magnetic field lines in the period A (left column) and B (right column) simulations, on days 0, 60, 120, and 180. Greyscale shading on r = r0 shows Br (white positive, black negative, saturated at ± 10 G), and projected coronal magnetic field lines traced from height r = r0 are coloured (red/blue) according to ![]() , saturated at ± 0.5 Mx. Animated versions of this figure for periods A and B are available online.
, saturated at ± 0.5 Mx. Animated versions of this figure for periods A and B are available online.
Current usage metrics show cumulative count of Article Views (full-text article views including HTML views, PDF and ePub downloads, according to the available data) and Abstracts Views on Vision4Press platform.
Data correspond to usage on the plateform after 2015. The current usage metrics is available 48-96 hours after online publication and is updated daily on week days.
Initial download of the metrics may take a while.