Fig. 9
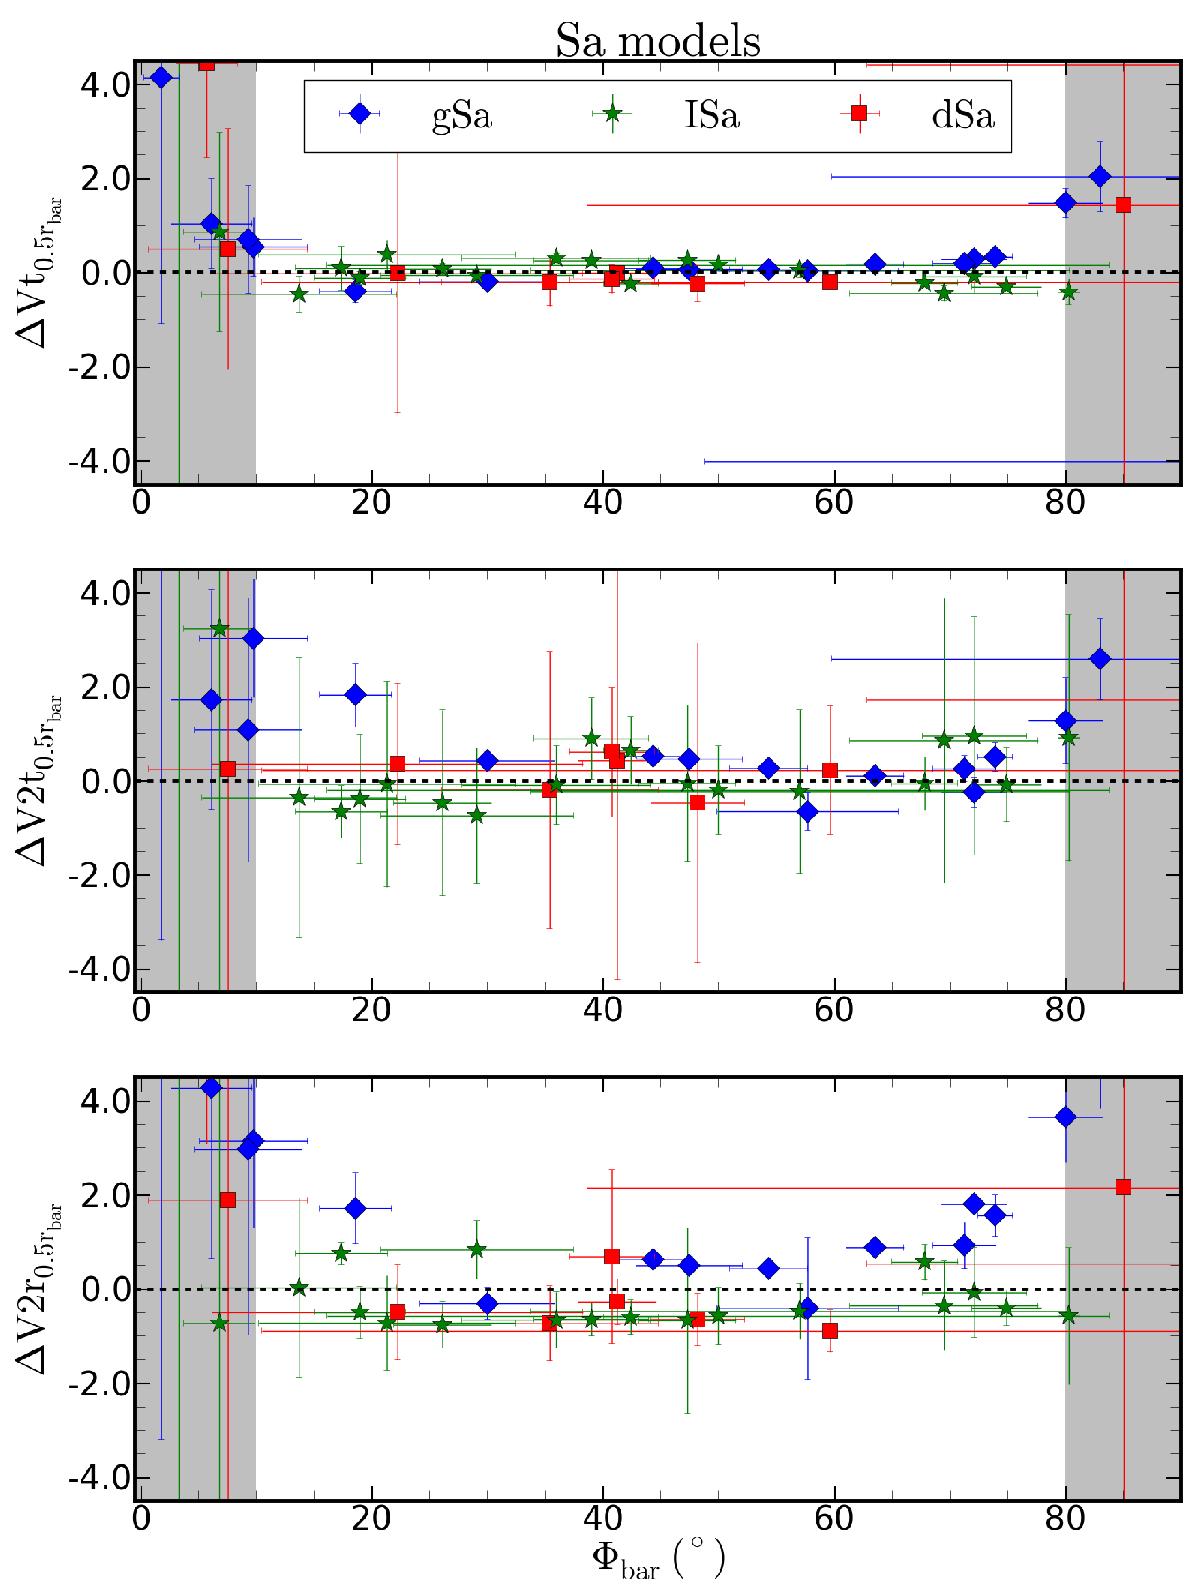
Ratio between the Fourier amplitudes and the DiskFit velocities at R = 0.5rbar (estimated from the Fourier decomposition of the stellar surface densities) for the spiral Sa models, giants (blue), intermediate (green) and dwarf (red). The ratio ΔVt = (Vt−A0,t) /A0,t is plotted in the top panel, ΔV2r = (V2r−A2,r) /A2,r in the middle panel and ΔV2t = (V2t−A2,t) /A2,t in the bottom panel. The shaded area shows the range of bar orientations where DiskFit fails to recover the bar orientation or velocities, or where the uncertainties on the returned parameters are large.
Current usage metrics show cumulative count of Article Views (full-text article views including HTML views, PDF and ePub downloads, according to the available data) and Abstracts Views on Vision4Press platform.
Data correspond to usage on the plateform after 2015. The current usage metrics is available 48-96 hours after online publication and is updated daily on week days.
Initial download of the metrics may take a while.