Fig. 6
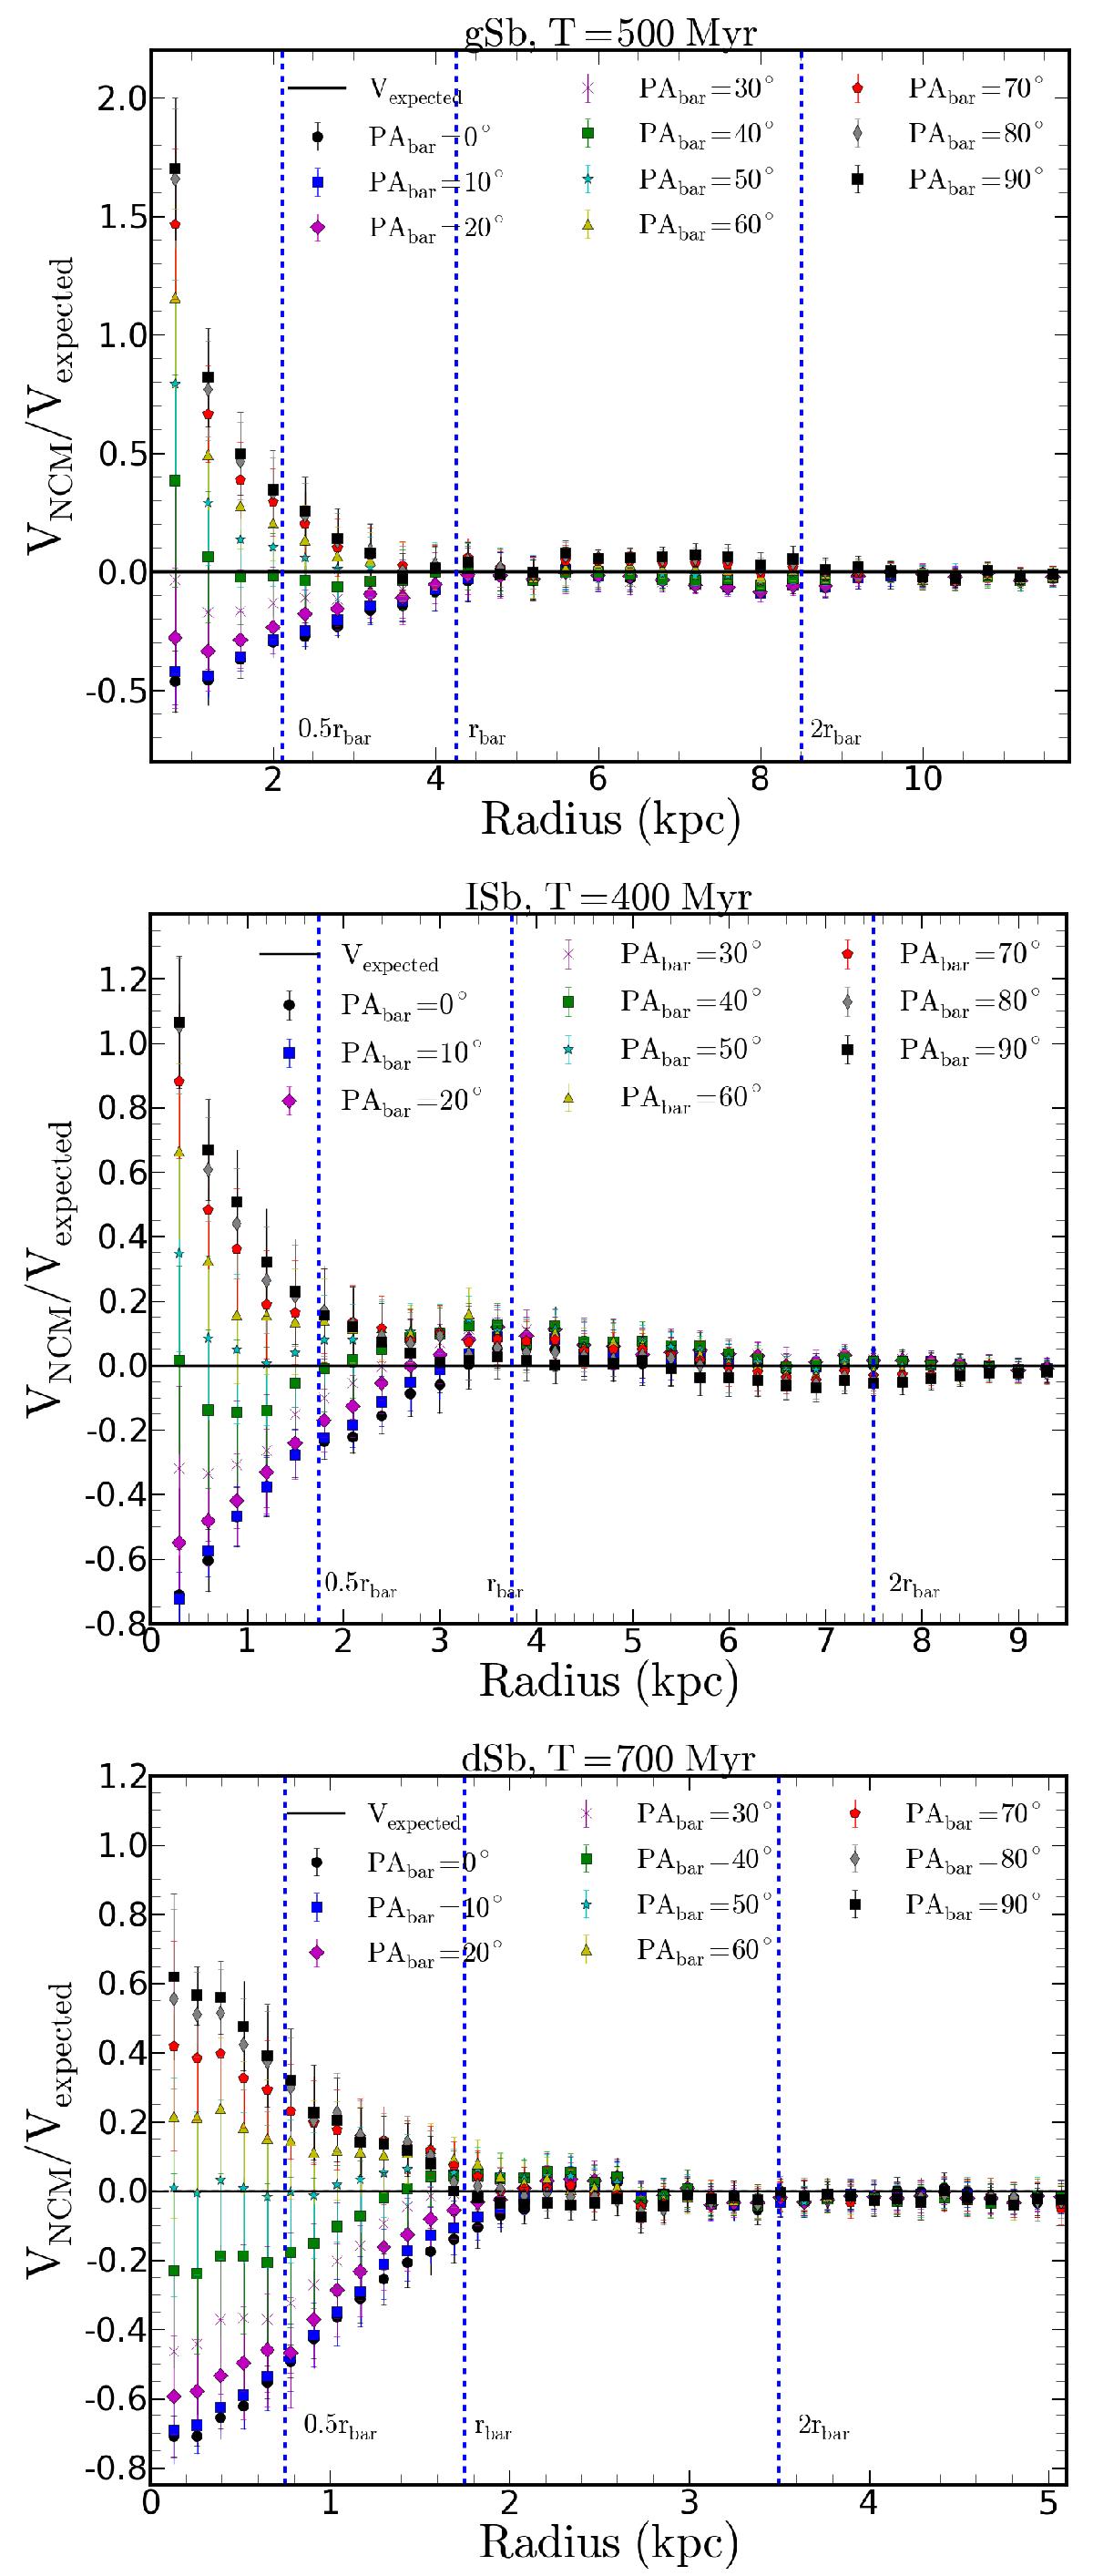
Ratio between VNCM = VROTCUR−Vexpected and Vexpected as a function of radius for the gSb, iSb and dSb models. The vertical dashed lines show 0.5, 1 and 2rbar estimated from the Fourier decomposition. Each rotation curve was derived from mock galaxies with projected bar orientation between 0 and 90 degrees. The projected bar PA are shown on top of each figure.
Current usage metrics show cumulative count of Article Views (full-text article views including HTML views, PDF and ePub downloads, according to the available data) and Abstracts Views on Vision4Press platform.
Data correspond to usage on the plateform after 2015. The current usage metrics is available 48-96 hours after online publication and is updated daily on week days.
Initial download of the metrics may take a while.