Fig. 5
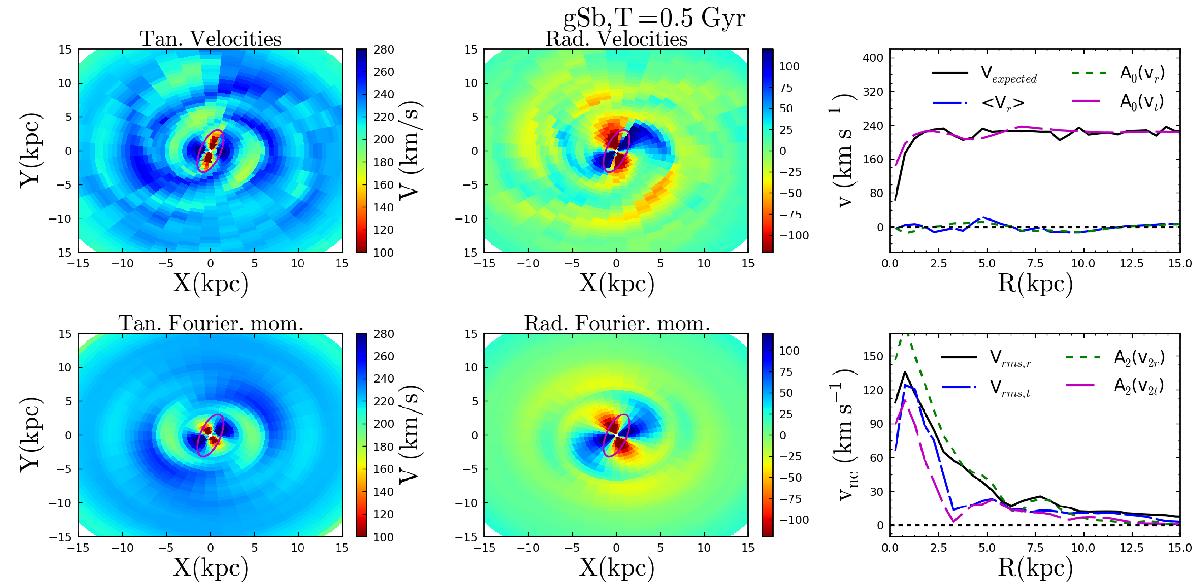
Example of the “intrinsic” rotation curve calculation for the gSb model. First column: the tangential velocities map is shown in the top panel and the tangential Fourier moments map in the bottom panel. Second column: the radial velocities map is shown in the top panel and the radial Fourier moment map in the bottom panel. Third column: the top panel shows the comparison between the expected circular velocities Vexpected calculated from the gravitational potential as a solid black line and the Fourier A0(Vt) as a long-dashed magenta line. The expected and Fourier axisymmetric radial velocities are shown as solid blue and dashed green lines, respectively. The non-circular velocities as a function of radius are plotted in the bottom panel. The continuous black line and the long-dashed blue line are the rms velocities estimated from the residual maps, and the dashed lines are the m = 2 Fourier components. The ellipse in the center of each map shows the location and orientation of the bar.
Current usage metrics show cumulative count of Article Views (full-text article views including HTML views, PDF and ePub downloads, according to the available data) and Abstracts Views on Vision4Press platform.
Data correspond to usage on the plateform after 2015. The current usage metrics is available 48-96 hours after online publication and is updated daily on week days.
Initial download of the metrics may take a while.