Fig. 4
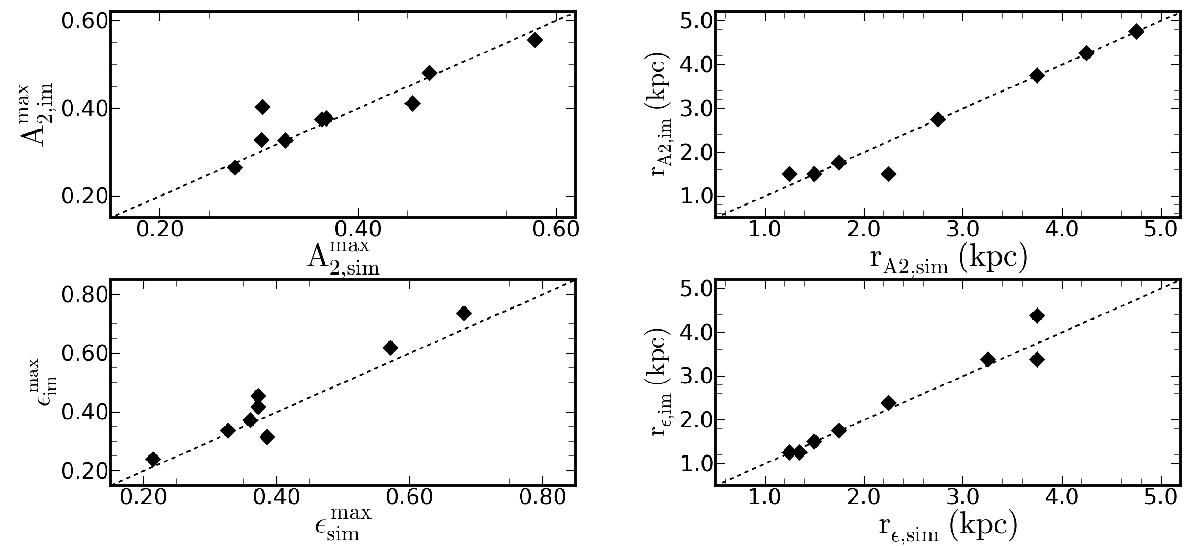
Comparison between the bar properties estimated within the simulation to those from images obtained from pseudo-observations. The maximum Fourier m = 2 amplitude estimated within the simulation is plotted against those obtained from images on the top left panel. Comparison between the maximum ellipticity measured within the simulation and from images is shown on the bottom left panel. The right panels show comparison between the bar radius estimated within the simulation with those measured from images, the bar radius obtained using the Fourier method is on the top panel and those obtained using the ellipse fitting technique on the bottom panel.
Current usage metrics show cumulative count of Article Views (full-text article views including HTML views, PDF and ePub downloads, according to the available data) and Abstracts Views on Vision4Press platform.
Data correspond to usage on the plateform after 2015. The current usage metrics is available 48-96 hours after online publication and is updated daily on week days.
Initial download of the metrics may take a while.