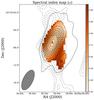
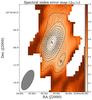
Fig. 5

Left: spectral index map for the radio emission in NGC 1377, derived from X- and L-band observations. Values are only shown where the spectral index uncertainty Δα/α is less than 30%. Solid contours show the X-band emission and are the same as in Fig. 2. Dashed contours show the L-band continuum emission smoothed to the X-band resolution, see text for discussion. The two main emission components are labeled as A and B, as in Fig. 2. Right: map of relative uncertainty for the derived spectral index.
Current usage metrics show cumulative count of Article Views (full-text article views including HTML views, PDF and ePub downloads, according to the available data) and Abstracts Views on Vision4Press platform.
Data correspond to usage on the plateform after 2015. The current usage metrics is available 48-96 hours after online publication and is updated daily on week days.
Initial download of the metrics may take a while.