Fig. 4
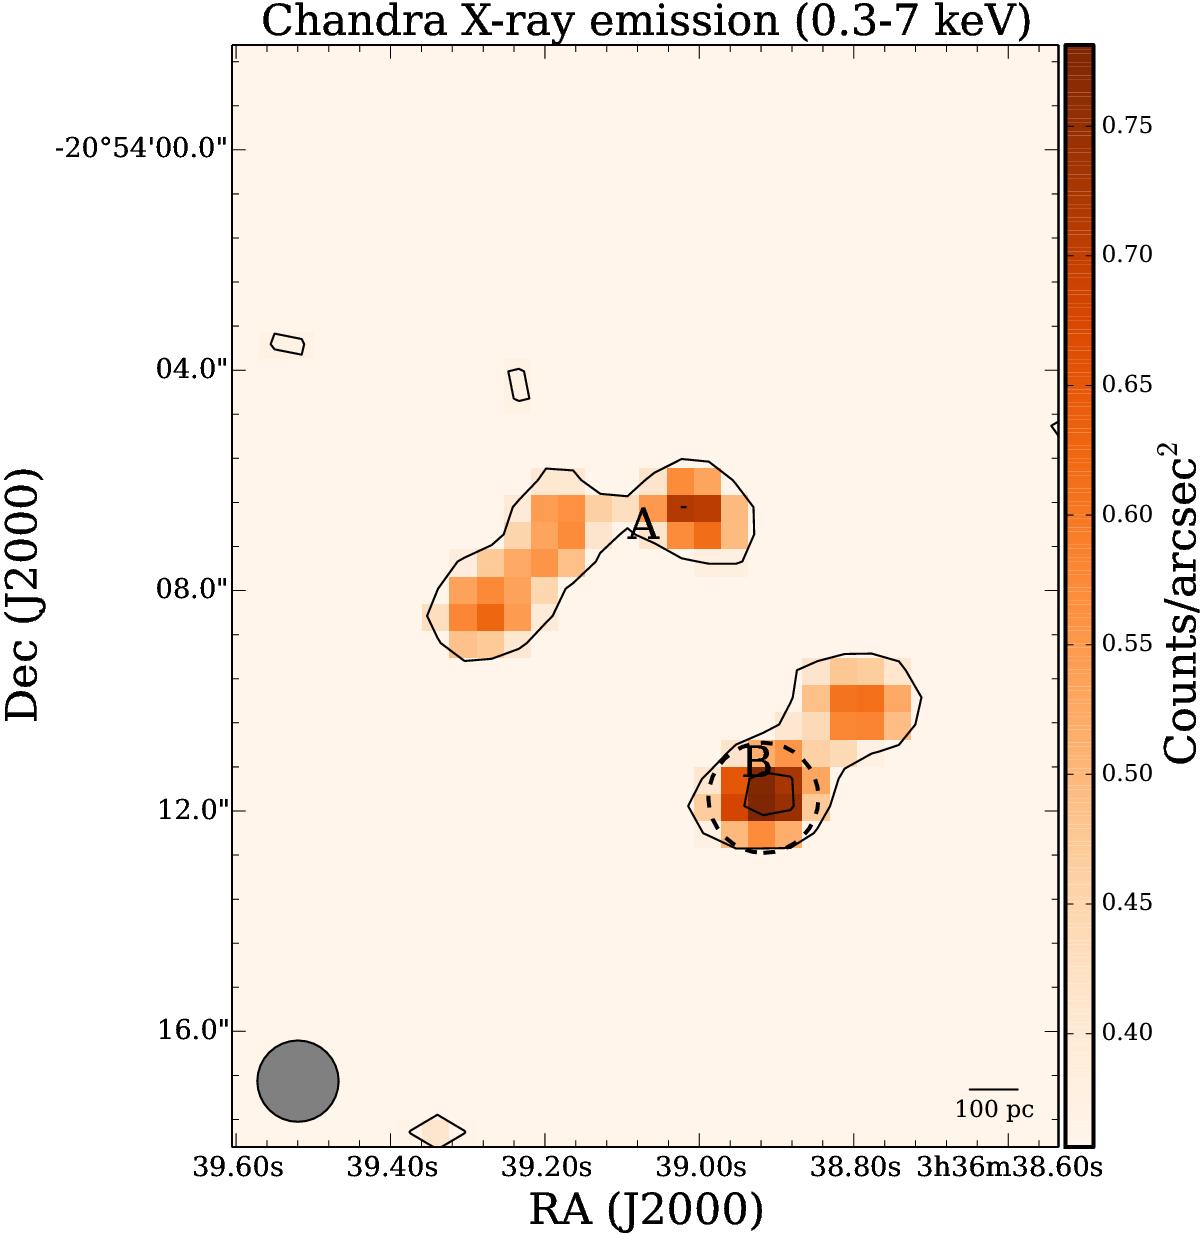
Detection of X-rays emission with Chandra. The observations were smoothed to a resolution of 1![]() 5. Contours are drawn every 0.35 counts/arcsec2 starting at 0.35 counts/arcsec2. The galaxy center is marked as A. The dashed ellipse shows the 2′′ × 2′′ region around position B which was used to calculate a signal-to-noise of 2.2σ (see Sect. 2.3 for discussion).
5. Contours are drawn every 0.35 counts/arcsec2 starting at 0.35 counts/arcsec2. The galaxy center is marked as A. The dashed ellipse shows the 2′′ × 2′′ region around position B which was used to calculate a signal-to-noise of 2.2σ (see Sect. 2.3 for discussion).
Current usage metrics show cumulative count of Article Views (full-text article views including HTML views, PDF and ePub downloads, according to the available data) and Abstracts Views on Vision4Press platform.
Data correspond to usage on the plateform after 2015. The current usage metrics is available 48-96 hours after online publication and is updated daily on week days.
Initial download of the metrics may take a while.