Fig. 9
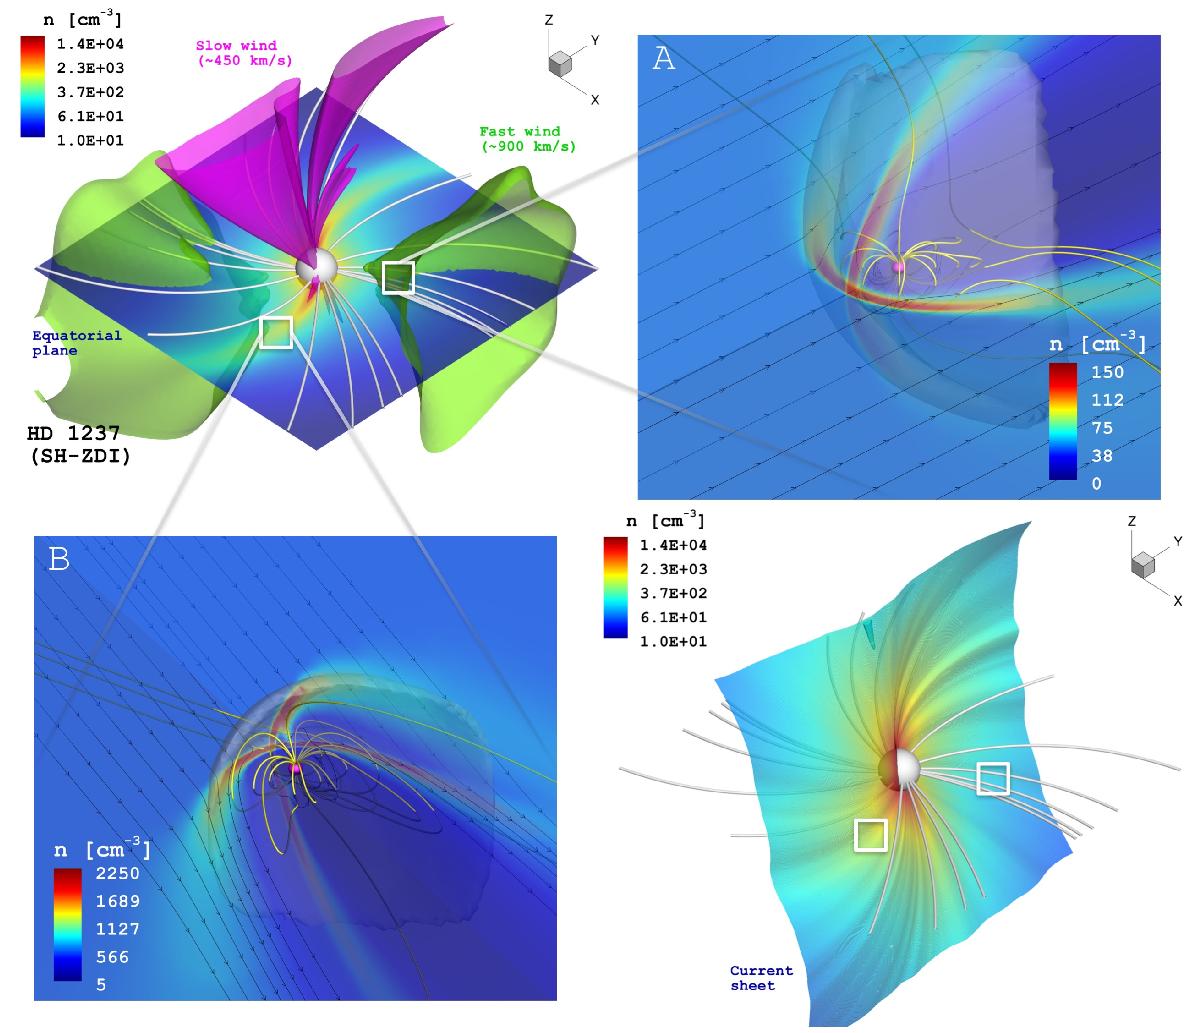
Simulated environment of the HD 1237 system driven by the SH-ZDI magnetic field map. The structure of the stellar wind and astrospheric current sheet obtained from the IH module, are presented in the top-left and bottom-right panels respectively. The density structure of the steady-state solution is displayed on the equatorial plane (top-left) and the astrospheric current sheet (bottom-right). In the top-left panel, the topology and associated magnitudes of the dominant radial velocity components (ur) of the stellar wind are also included (fast: green – slow: magenta). The central white sphere denotes the boundary with the SC domain at 25 R∗ (Sect. 3.1), and selected 3D stellar wind magnetic field lines are shown in white. The two remaining panels contain the simulation results of the GM module, obtained at the locations indicated on the IH domain by the white squares (not to scale). The distance to the star has been taken as the mean orbital separation of this system (a = 0.49 AU, Naef et al. 2001). The central purple sphere corresponds to the planetary surface (1 Rp) and selected 3D planetary magnetic field lines are displayed in yellow. The direction of the incident stellar wind is indicated by the black streamlines. The particle density distribution of the solution shows the development of a bow-shock structure in both cases (translucent white shade).
Current usage metrics show cumulative count of Article Views (full-text article views including HTML views, PDF and ePub downloads, according to the available data) and Abstracts Views on Vision4Press platform.
Data correspond to usage on the plateform after 2015. The current usage metrics is available 48-96 hours after online publication and is updated daily on week days.
Initial download of the metrics may take a while.