Fig. 5
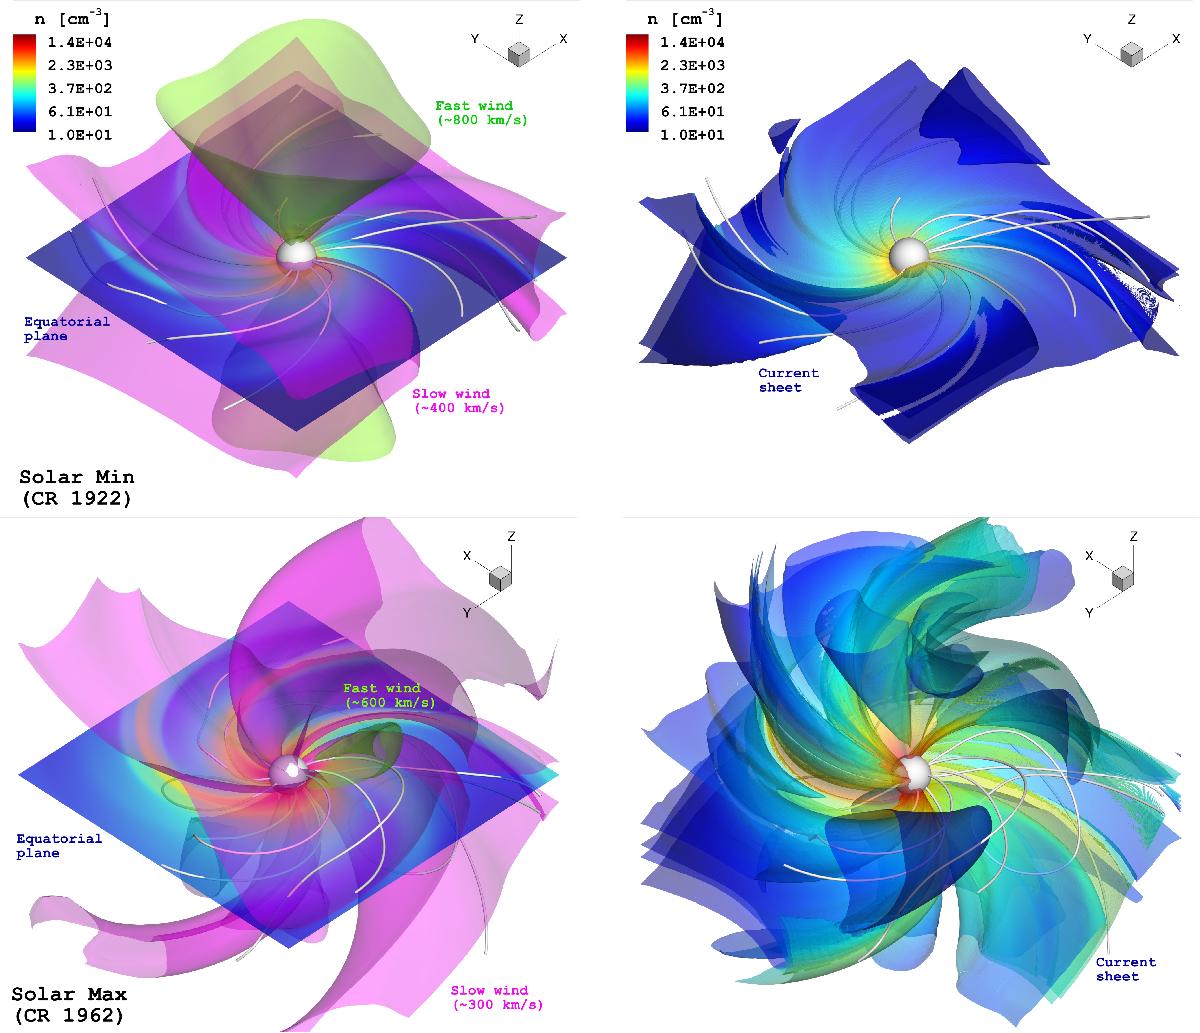
Simulation results in the inner heliosphere (IH) domain for activity minimum (CR 1922, top) and maximum (CR 1962, bottom). The central white sphere denotes the boundary with the solar corona (SC) domain at 25 R⊙ (Sect. 3.1). The density structure of the steady-state solution is displayed on the equatorial plane (left) and the heliospheric current sheet (right). In the left panel, the topology and associated magnitudes of the dominant radial velocity components (ur) of the solar wind are also included (fast: green – slow: magenta). The density (n) colour scale is preserved among the different panels. Selected 3D magnetic field lines are shown in white.
Current usage metrics show cumulative count of Article Views (full-text article views including HTML views, PDF and ePub downloads, according to the available data) and Abstracts Views on Vision4Press platform.
Data correspond to usage on the plateform after 2015. The current usage metrics is available 48-96 hours after online publication and is updated daily on week days.
Initial download of the metrics may take a while.