Fig. 11
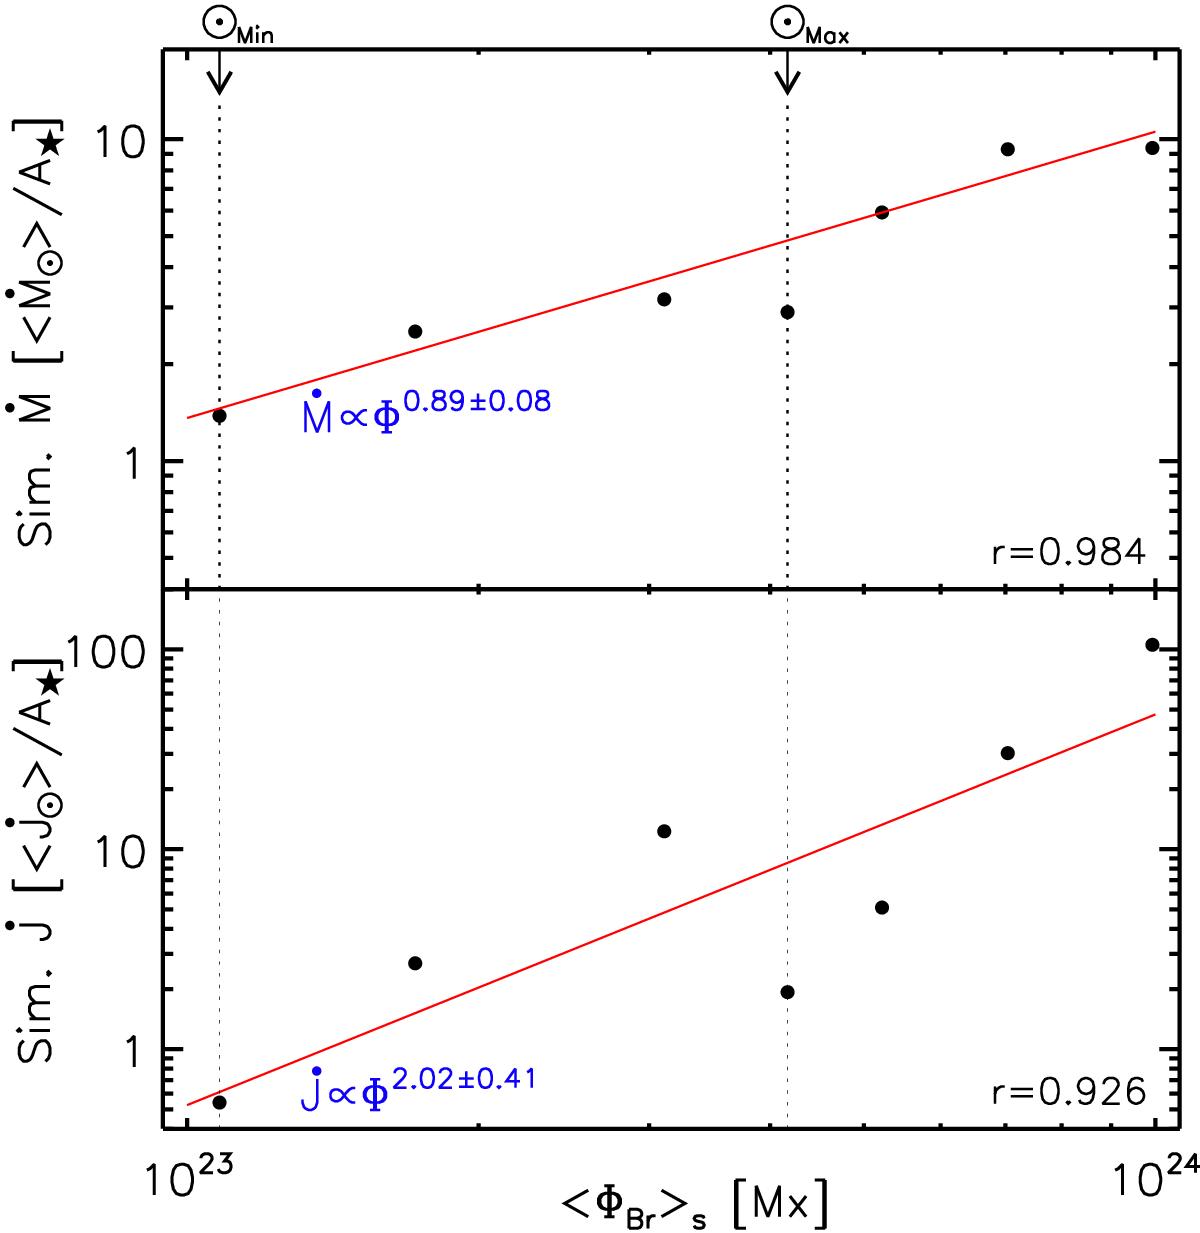
Simulated mass loss rate (Ṁ, top) and angular momentum loss rate (![]() , bottom) as a function of the surface-averaged unsigned radial magnetic flux ⟨ΦBr⟩s. Both quantities are expressed in units of average solar values (Sect. 3.1), normalised by the surface area of each star. Individual points denote the results of each simulation presented in Sect. 3, including the solar cases (indicated by the dashed vertical lines). The red solid lines show power-law fits to the simulated data with the corresponding correlation coefficient, r, in each case.
, bottom) as a function of the surface-averaged unsigned radial magnetic flux ⟨ΦBr⟩s. Both quantities are expressed in units of average solar values (Sect. 3.1), normalised by the surface area of each star. Individual points denote the results of each simulation presented in Sect. 3, including the solar cases (indicated by the dashed vertical lines). The red solid lines show power-law fits to the simulated data with the corresponding correlation coefficient, r, in each case.
Current usage metrics show cumulative count of Article Views (full-text article views including HTML views, PDF and ePub downloads, according to the available data) and Abstracts Views on Vision4Press platform.
Data correspond to usage on the plateform after 2015. The current usage metrics is available 48-96 hours after online publication and is updated daily on week days.
Initial download of the metrics may take a while.