Fig. 3
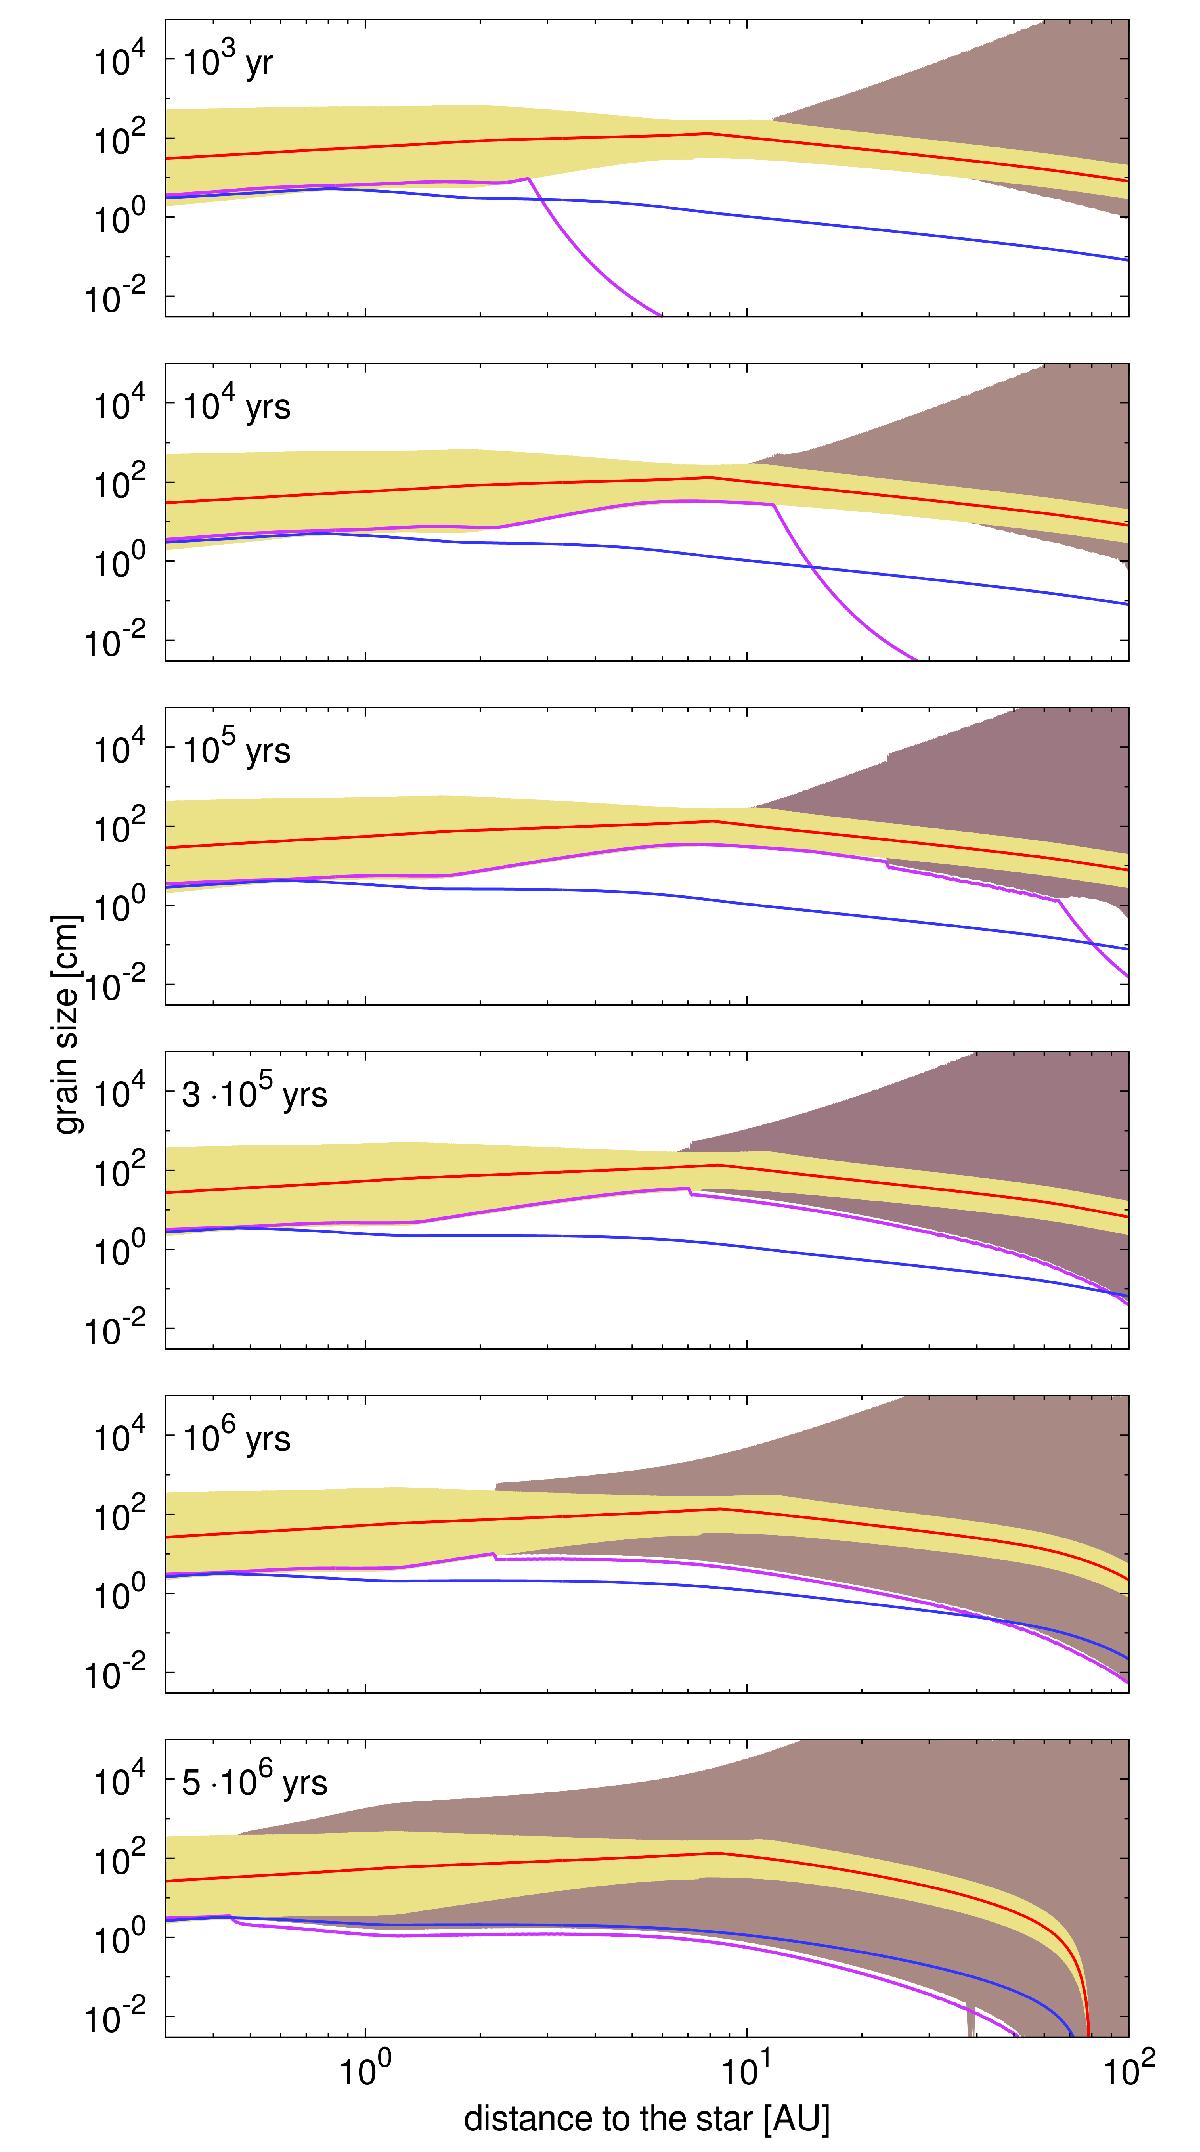
Time evolution of the growth barriers. The plotting style corresponds to Fig. 1: the yellow region corresponds to the fragmentation barrier while the grey region indicates the drift regime. The red and blue horizontal lines denote sizes corresponding to the Stokes number of unity and 10-2, respectively. The purple line shows the maximum size of dust aggregates, which generally follows the growth barriers, except for the earliest stages of evolution, when it is restricted by the growth timescale. The radial drift barrier gains significance as the dust-to-gas ratio decreases during the evolution.
Current usage metrics show cumulative count of Article Views (full-text article views including HTML views, PDF and ePub downloads, according to the available data) and Abstracts Views on Vision4Press platform.
Data correspond to usage on the plateform after 2015. The current usage metrics is available 48-96 hours after online publication and is updated daily on week days.
Initial download of the metrics may take a while.