Fig. 9
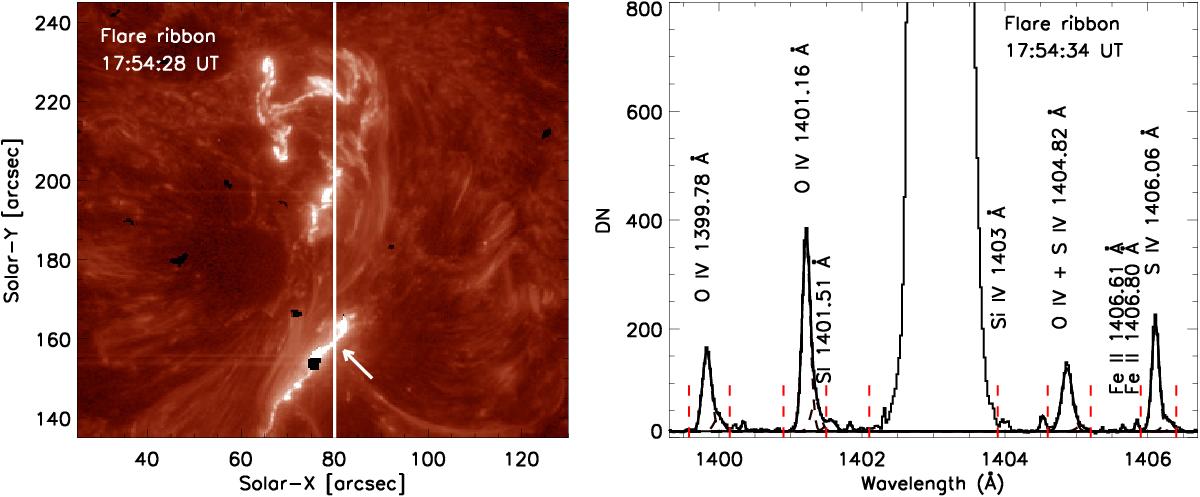
Left: IRIS Slit Jaw Image in the Si iv 1400 Å filter, showing the flare ribbons and the position of the IRIS spectrograph slit (vertical white line). The black pixels are due to dust contamination on the IRIS detector. Right: Si iv window observed by the IRIS spectrograph at the southern flare ribbon, at the location indicated by the arrow. The dotted red lines represent the wavelength limits which were assumed when summing the total counts for each line. See text for further details (Sect. 4.3).
Current usage metrics show cumulative count of Article Views (full-text article views including HTML views, PDF and ePub downloads, according to the available data) and Abstracts Views on Vision4Press platform.
Data correspond to usage on the plateform after 2015. The current usage metrics is available 48-96 hours after online publication and is updated daily on week days.
Initial download of the metrics may take a while.