Free Access
Fig. 8
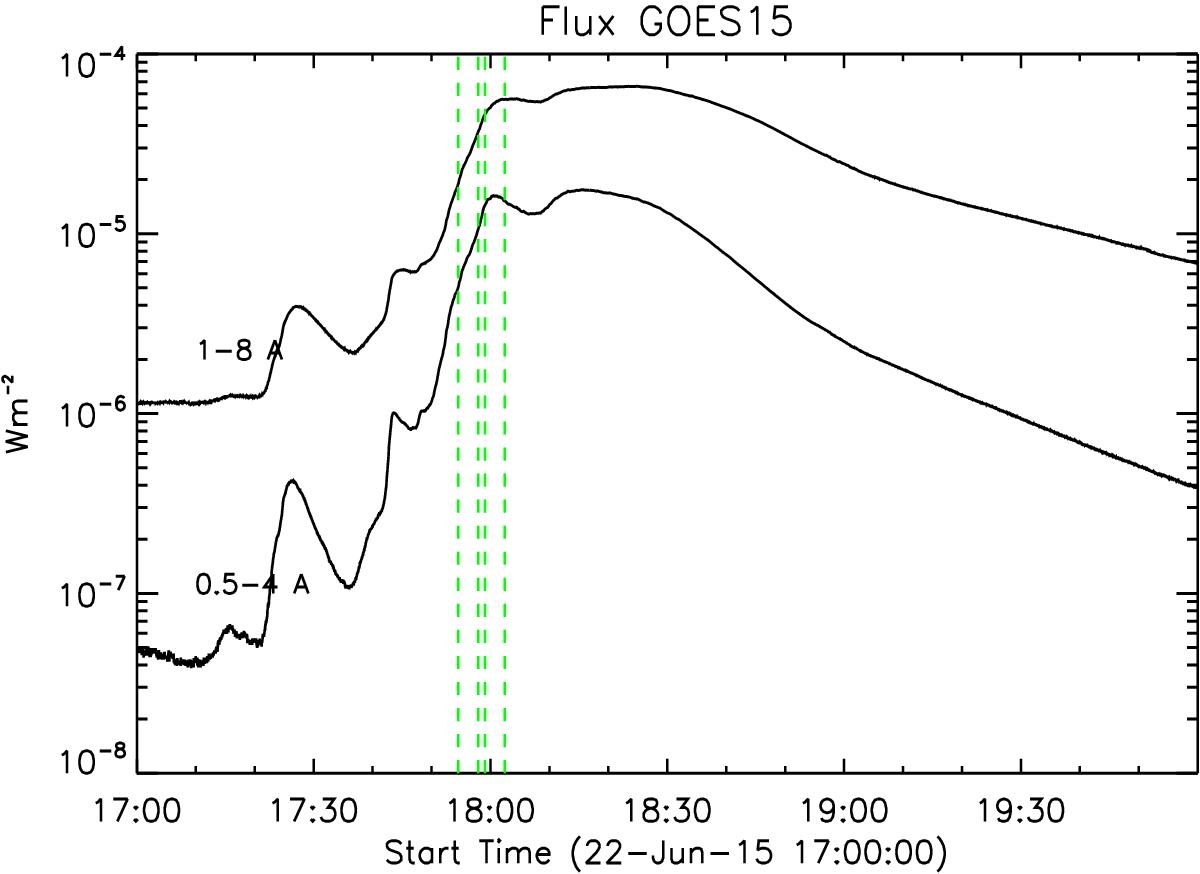
Soft X-ray light curves as measured by the GOES satellite in the 0.5–4 Å and 1–8 Å chennels during the 22-June-2015 flare. The dotted green lines represent the times of the IRIS rasters that were selected for measuring the electron density, as indicated in Table 4.
Current usage metrics show cumulative count of Article Views (full-text article views including HTML views, PDF and ePub downloads, according to the available data) and Abstracts Views on Vision4Press platform.
Data correspond to usage on the plateform after 2015. The current usage metrics is available 48-96 hours after online publication and is updated daily on week days.
Initial download of the metrics may take a while.