Fig. 4
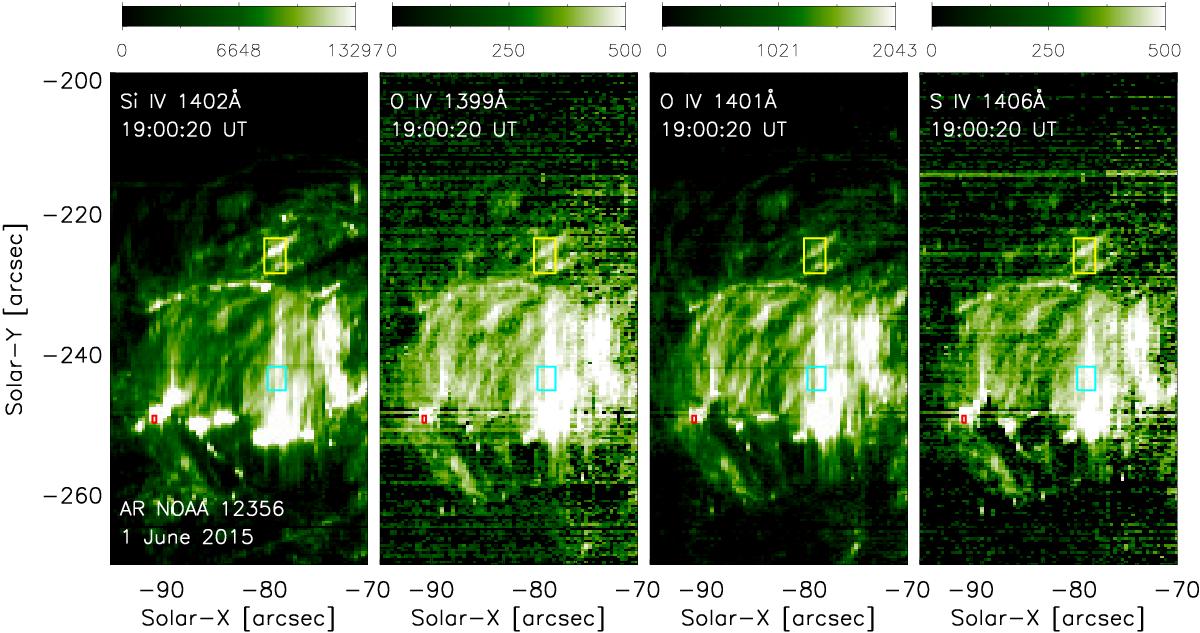
Monochromatic images of the AR NOAA 12356 observed by IRIS showing the intensity of different transition region spectral lines. From left to right: Si iv 1402.77 Å , O iv 1399.78 Å and 1401.16 Å and S iv 1406.93 Å. The units are phot s-1 arcsec-2 cm-2. The yellow, light blue and red coloured boxes represent the regions where we acquired the plage, loop and bright point spectra respectively, which are shown in Fig. 5. The time halfway through the IRIS raster is indicated in each panel.
Current usage metrics show cumulative count of Article Views (full-text article views including HTML views, PDF and ePub downloads, according to the available data) and Abstracts Views on Vision4Press platform.
Data correspond to usage on the plateform after 2015. The current usage metrics is available 48-96 hours after online publication and is updated daily on week days.
Initial download of the metrics may take a while.