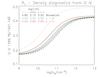
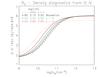
Fig. C.1
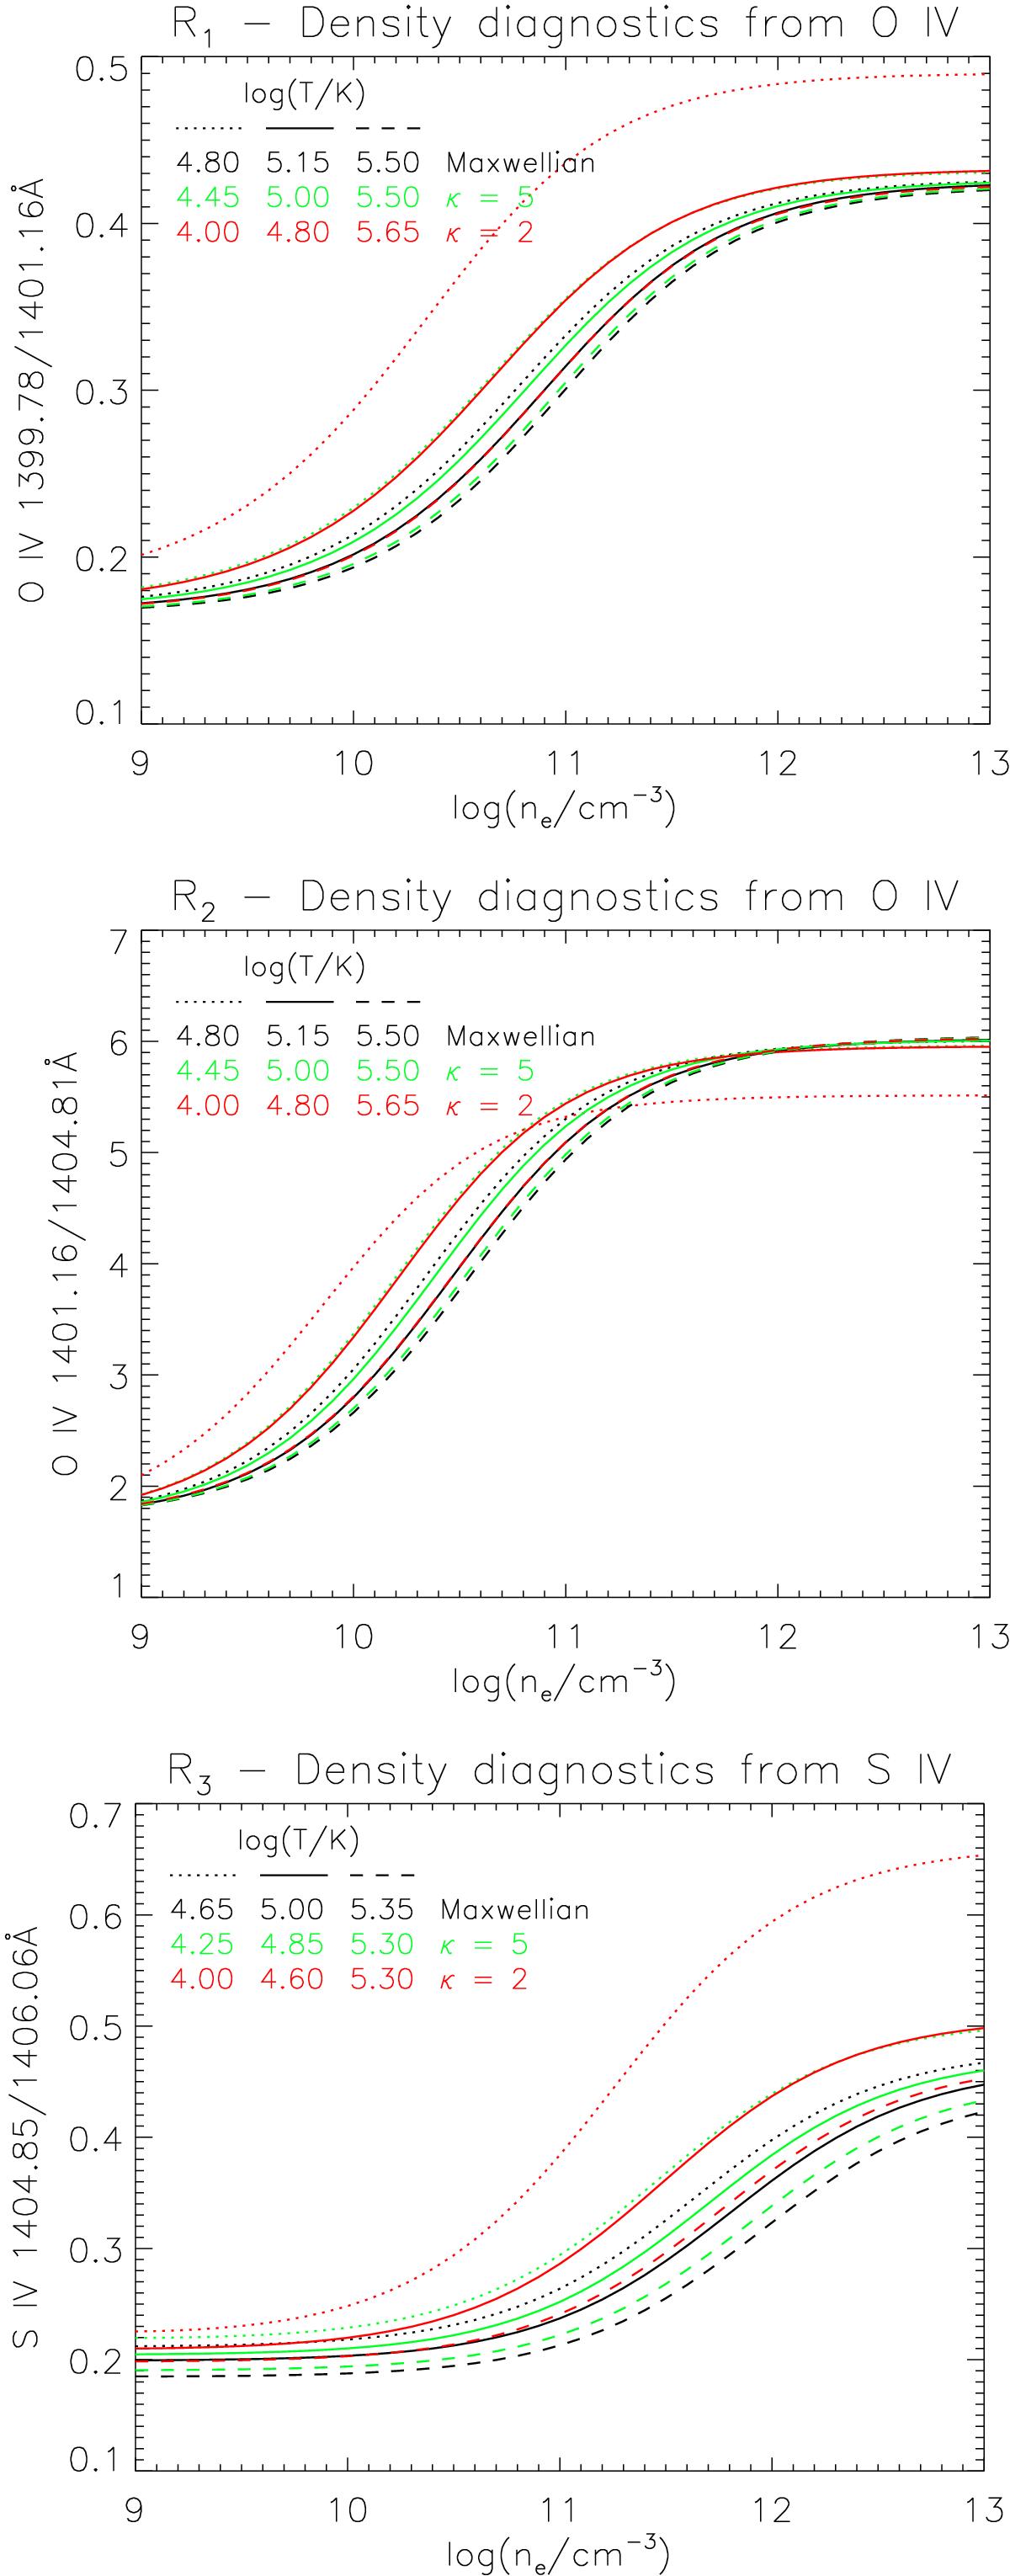
Theoretical density diagnostics using the ratios R1–R3 for the non-Maxwellian κ-distributions. Maxwellian ratios are shown in black, while ratios for κ = 5 and 2 are shown in green and red, respectively. Three lines for each distribution are shown, with the full lines showing the ratio at the respective peak of the relative ion abundance, while the dotted and dashed ones correspond to temperatures where the relative ion abundance is 0.01 of the maximum value.
Current usage metrics show cumulative count of Article Views (full-text article views including HTML views, PDF and ePub downloads, according to the available data) and Abstracts Views on Vision4Press platform.
Data correspond to usage on the plateform after 2015. The current usage metrics is available 48-96 hours after online publication and is updated daily on week days.
Initial download of the metrics may take a while.