Fig. B.1
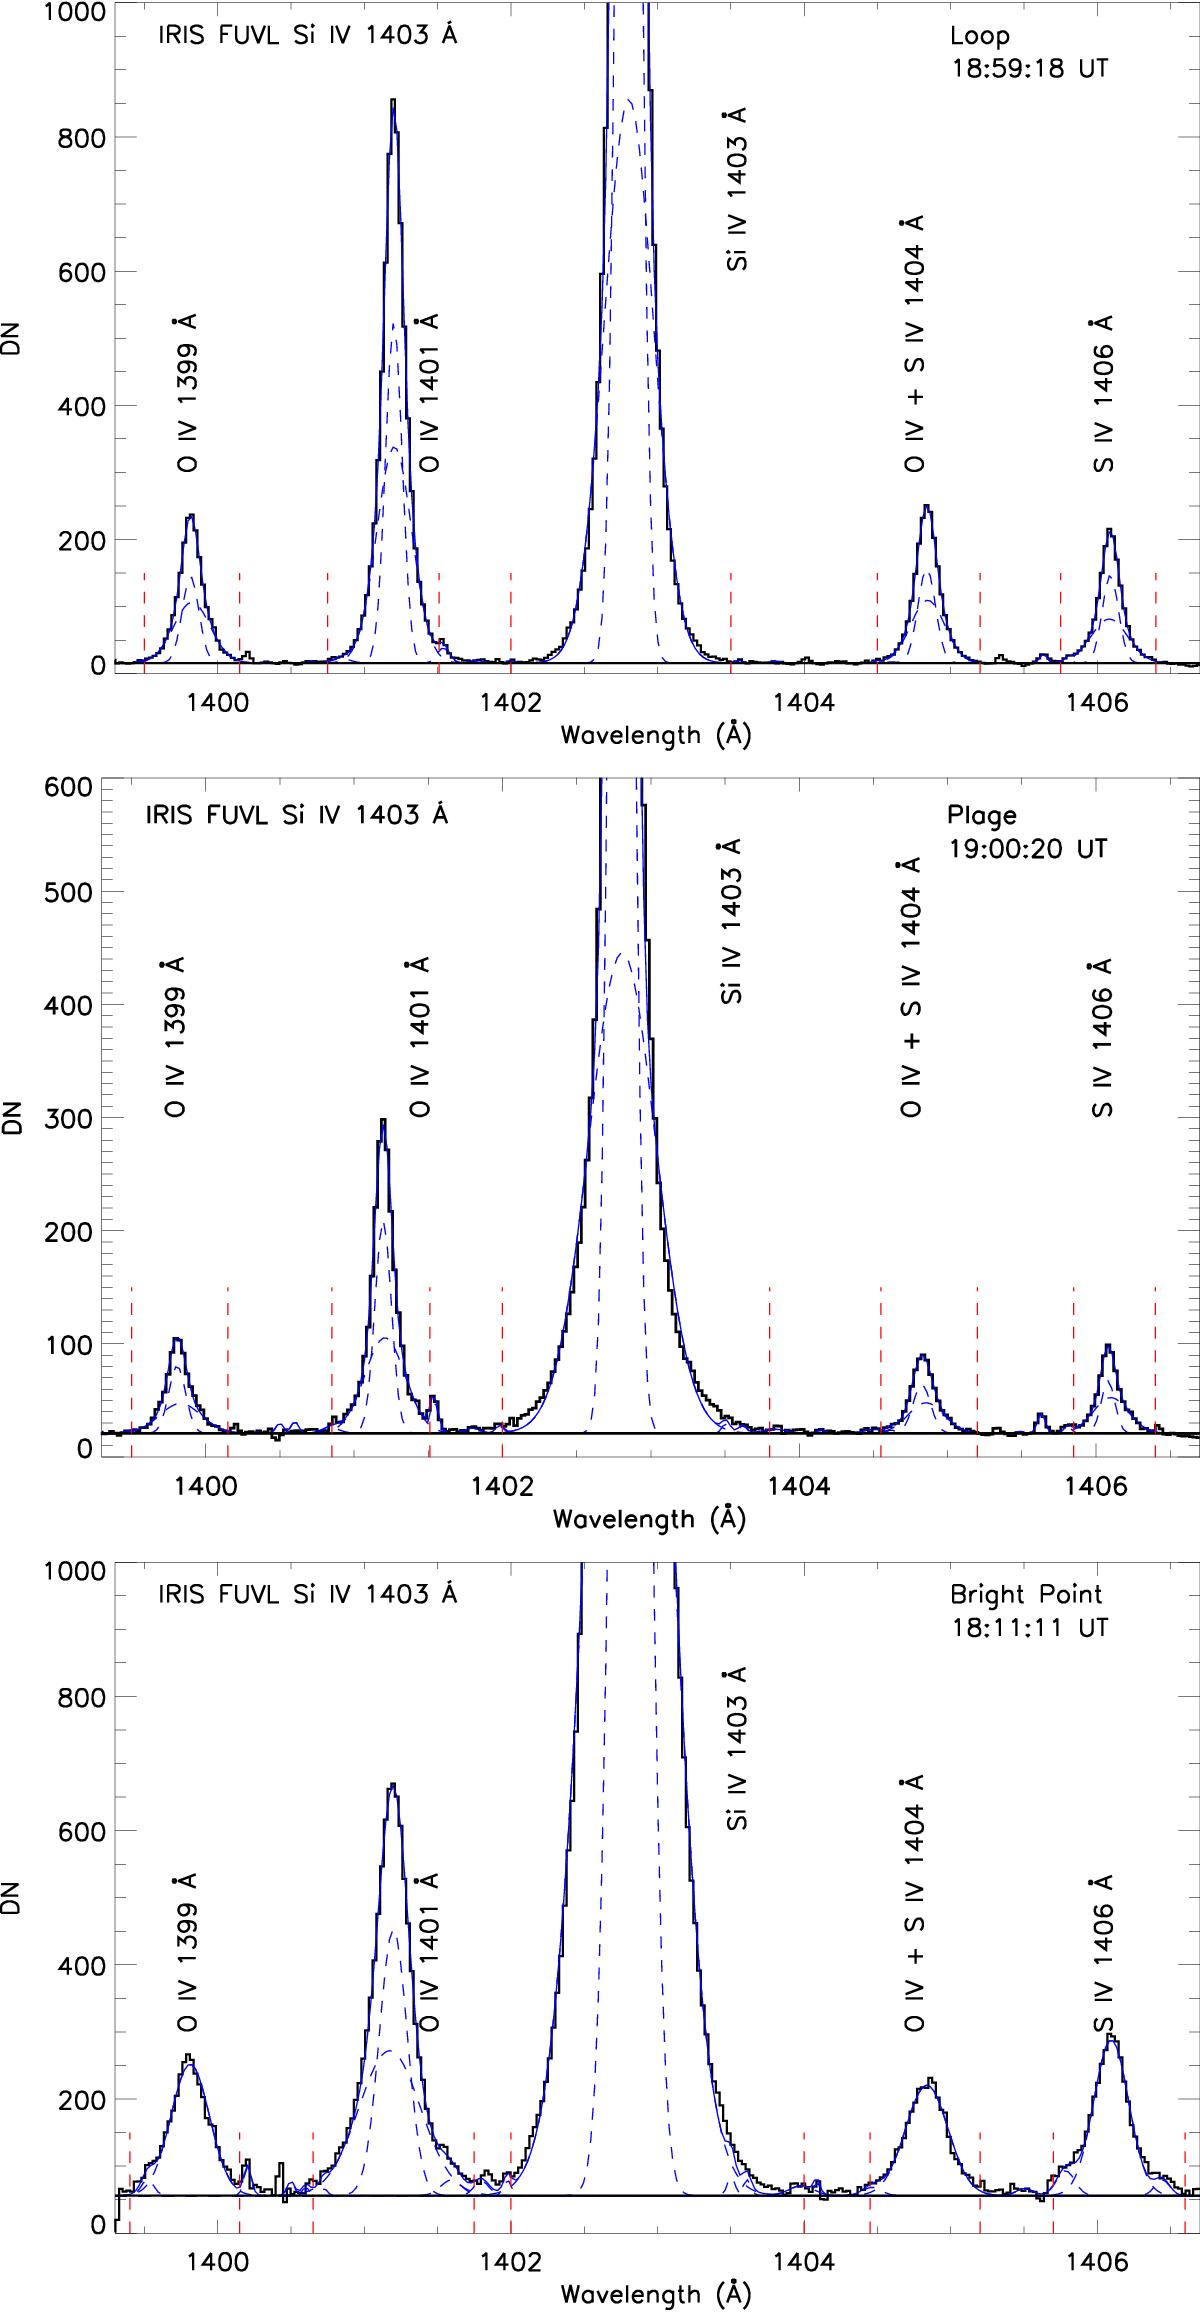
Zoomed loop (top), plage (middle) and bright point (bottom) spectra in the AR 12356. The blue dotted lines represent the single Gaussian component from the fit, while the continuous blue line is the sum of these components. We note that the Si iv line at 1402.77 Å is not properly fitted by two fit components alone. The red vertical dotted lines represent the wavelength interval over which we integrated the total counts for each line.
Current usage metrics show cumulative count of Article Views (full-text article views including HTML views, PDF and ePub downloads, according to the available data) and Abstracts Views on Vision4Press platform.
Data correspond to usage on the plateform after 2015. The current usage metrics is available 48-96 hours after online publication and is updated daily on week days.
Initial download of the metrics may take a while.