Fig. 14
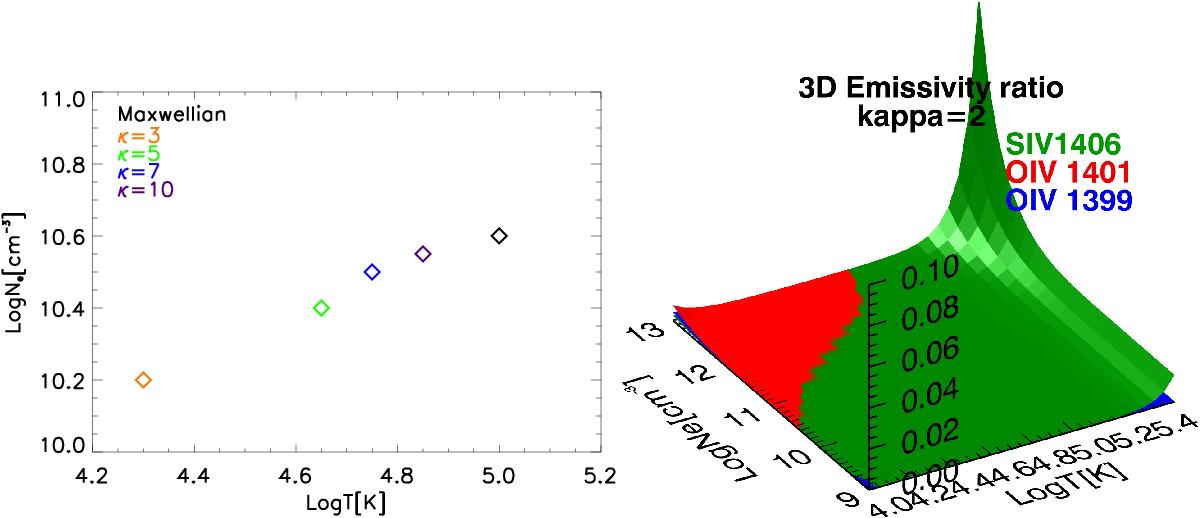
Left: density (x-axis) and temperature (y-axis) values at the 3D emissivity plot crossing points for the AR loop, obtained assuming non-Maxwellian distributions with different values of κ, except for κ = 2. The density and temperature values for the Maxwellian case in Sect. 4.2 are also shown for comparison. Right: 3D emissivity ratio for the κ = 2 case. We note that there is no crossing point in this case. Different colours for the surfaces indicate different ions as described in the legend.
Current usage metrics show cumulative count of Article Views (full-text article views including HTML views, PDF and ePub downloads, according to the available data) and Abstracts Views on Vision4Press platform.
Data correspond to usage on the plateform after 2015. The current usage metrics is available 48-96 hours after online publication and is updated daily on week days.
Initial download of the metrics may take a while.