Fig. 13
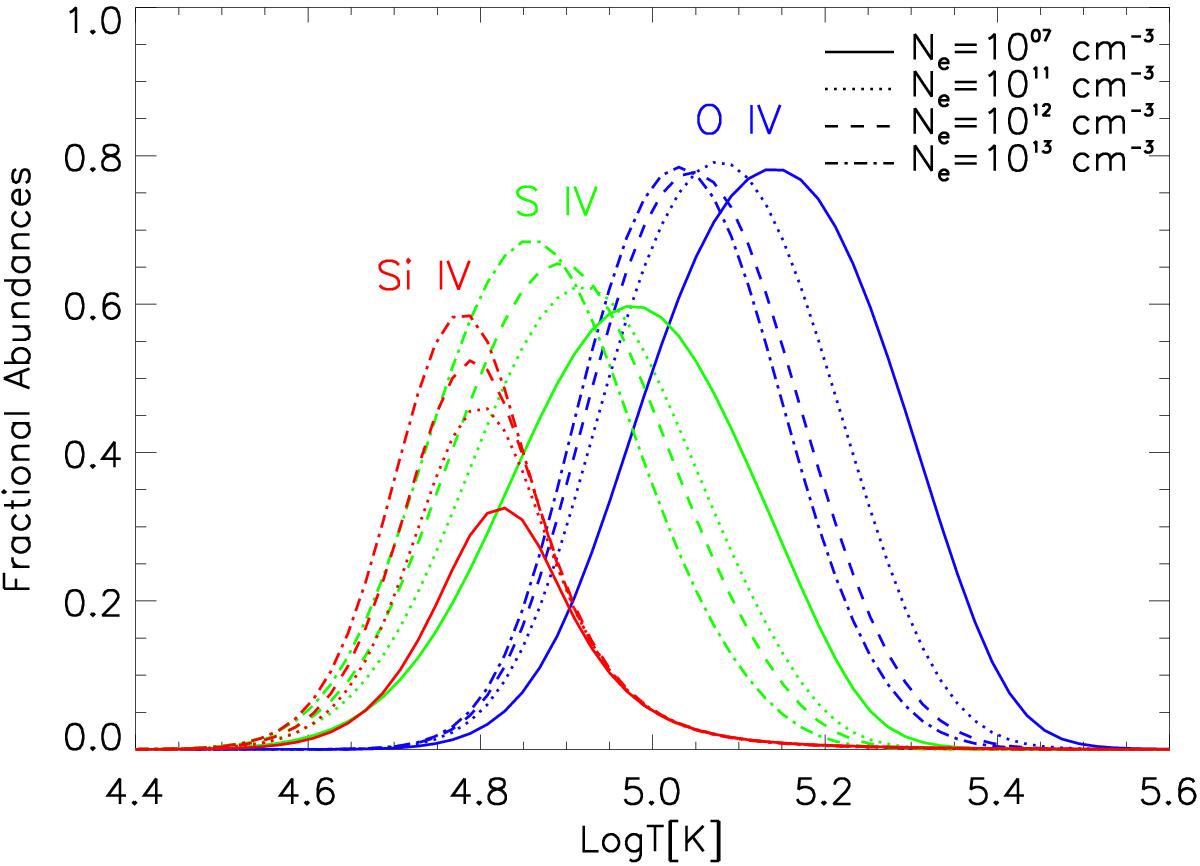
Fractional ion abundances N(X+ m) /N(X) for O iv (blue lines), S iv (green lines) and Si iv (red lines) calculated as a function of different electron number densities using atomic data from the OPEN-ADAS database. The continuous, dotted, dashed and dot-dashed lines indicate a different value of electron number density used to calculate the fractional ion abundances for each ion, as described in the legend.
Current usage metrics show cumulative count of Article Views (full-text article views including HTML views, PDF and ePub downloads, according to the available data) and Abstracts Views on Vision4Press platform.
Data correspond to usage on the plateform after 2015. The current usage metrics is available 48-96 hours after online publication and is updated daily on week days.
Initial download of the metrics may take a while.