Free Access
Fig. 10
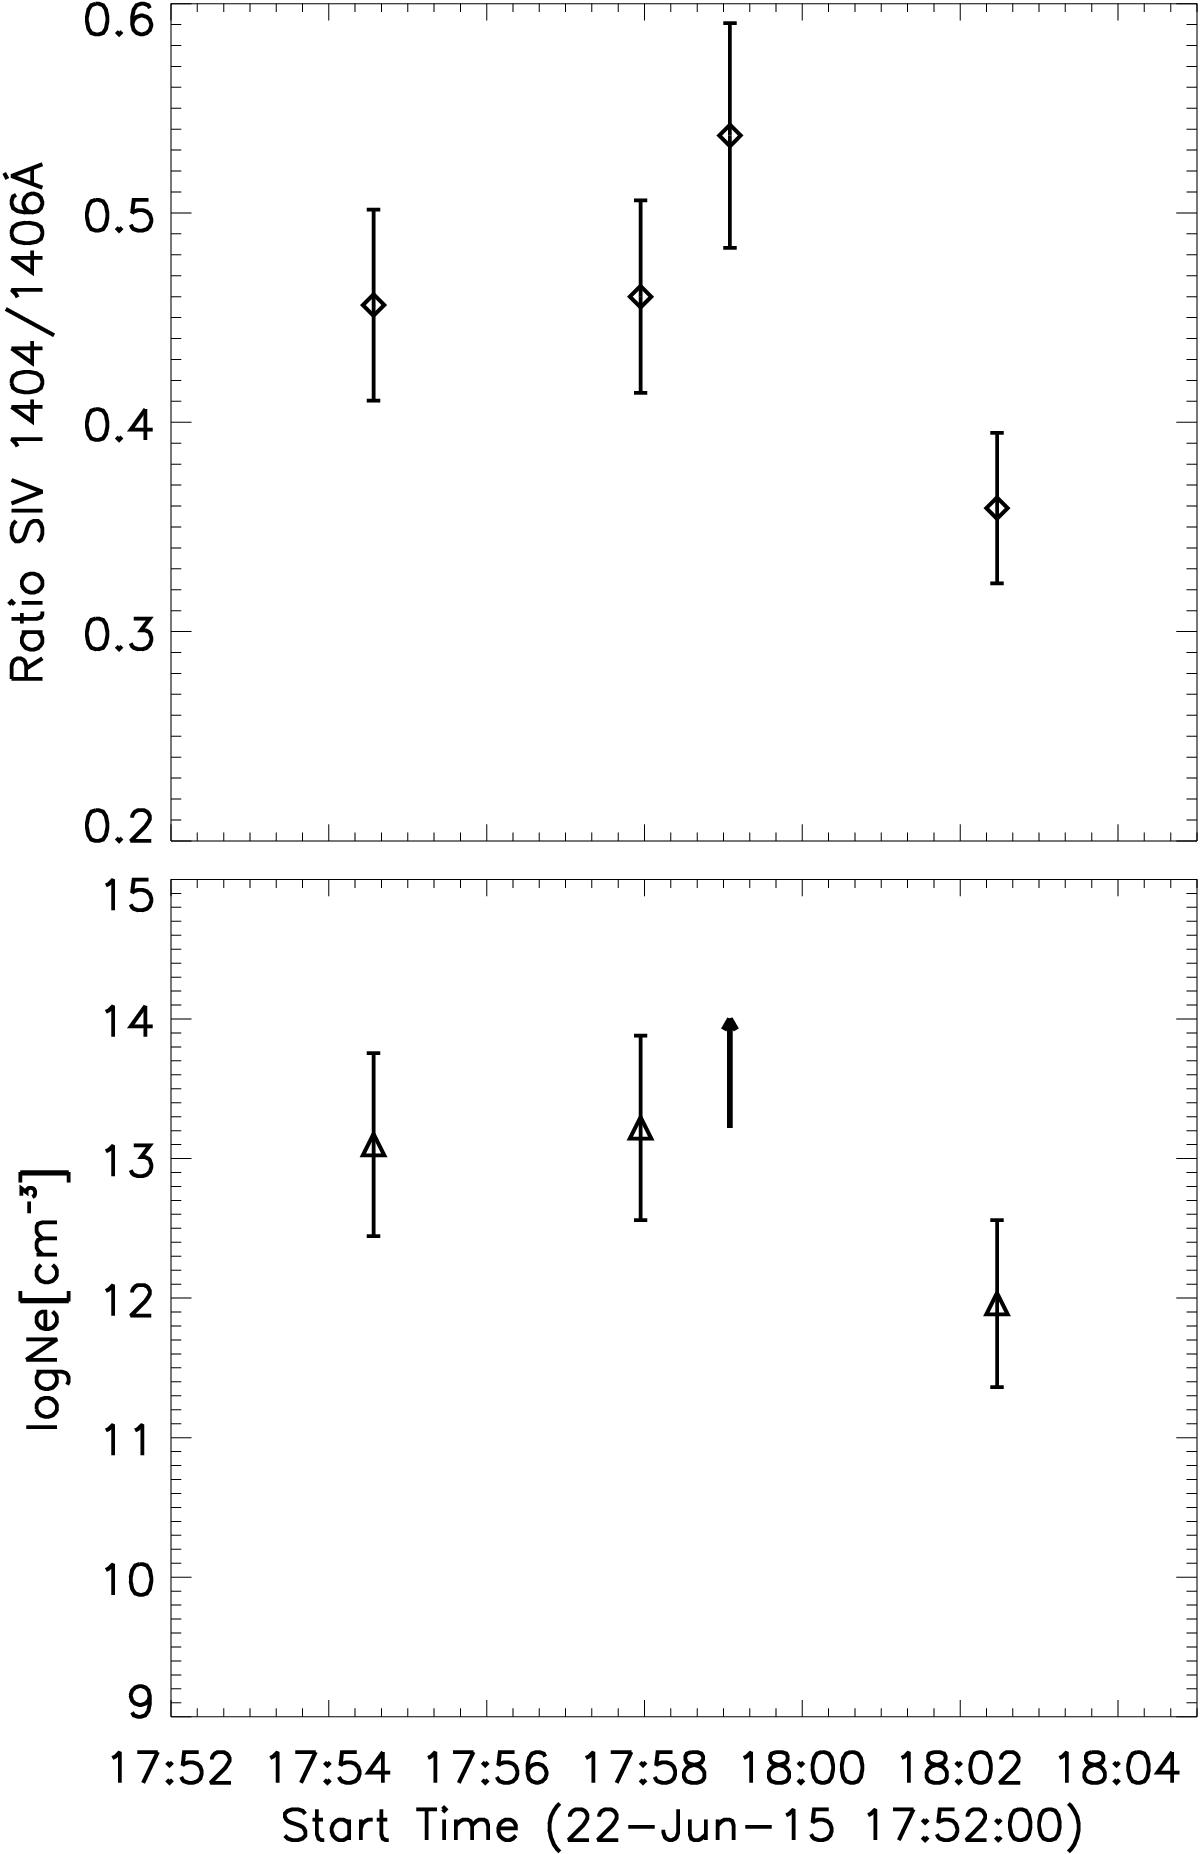
Ratio of S iv 1404/1406 lines (top panel) and derived electron density (bottom panel) as a function of time for the 22-June-2015 flare. The arrow indicates the high density limit (≈1013 cm-3) of the S ivR3 line ratio.
Current usage metrics show cumulative count of Article Views (full-text article views including HTML views, PDF and ePub downloads, according to the available data) and Abstracts Views on Vision4Press platform.
Data correspond to usage on the plateform after 2015. The current usage metrics is available 48-96 hours after online publication and is updated daily on week days.
Initial download of the metrics may take a while.