Fig. 1
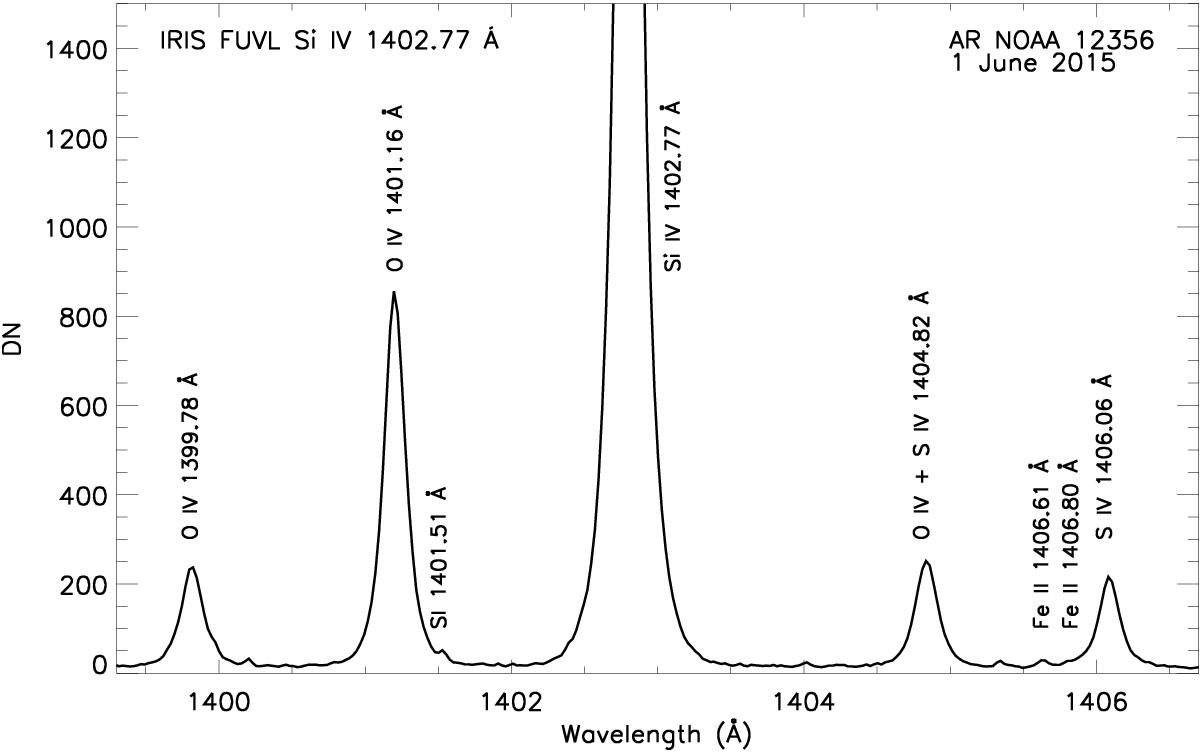
Example of a spectrum observed by IRIS in the AR 12356 (see Sect. 4.2) showing emission lines from the transition region. The figure shows the O iv + S iv blend at around 1404.82 Å, and the wings of the O iv 1401.16 Å and S iv 1406.06 Å lines blending with photospheric cooler transitions (S i and Fe ii respectively). In addition, we note that the shape of the IRIS line profiles for these ions is not Gaussian, but rather similar to a generalized Lorentzian function.
Current usage metrics show cumulative count of Article Views (full-text article views including HTML views, PDF and ePub downloads, according to the available data) and Abstracts Views on Vision4Press platform.
Data correspond to usage on the plateform after 2015. The current usage metrics is available 48-96 hours after online publication and is updated daily on week days.
Initial download of the metrics may take a while.