Fig. 7
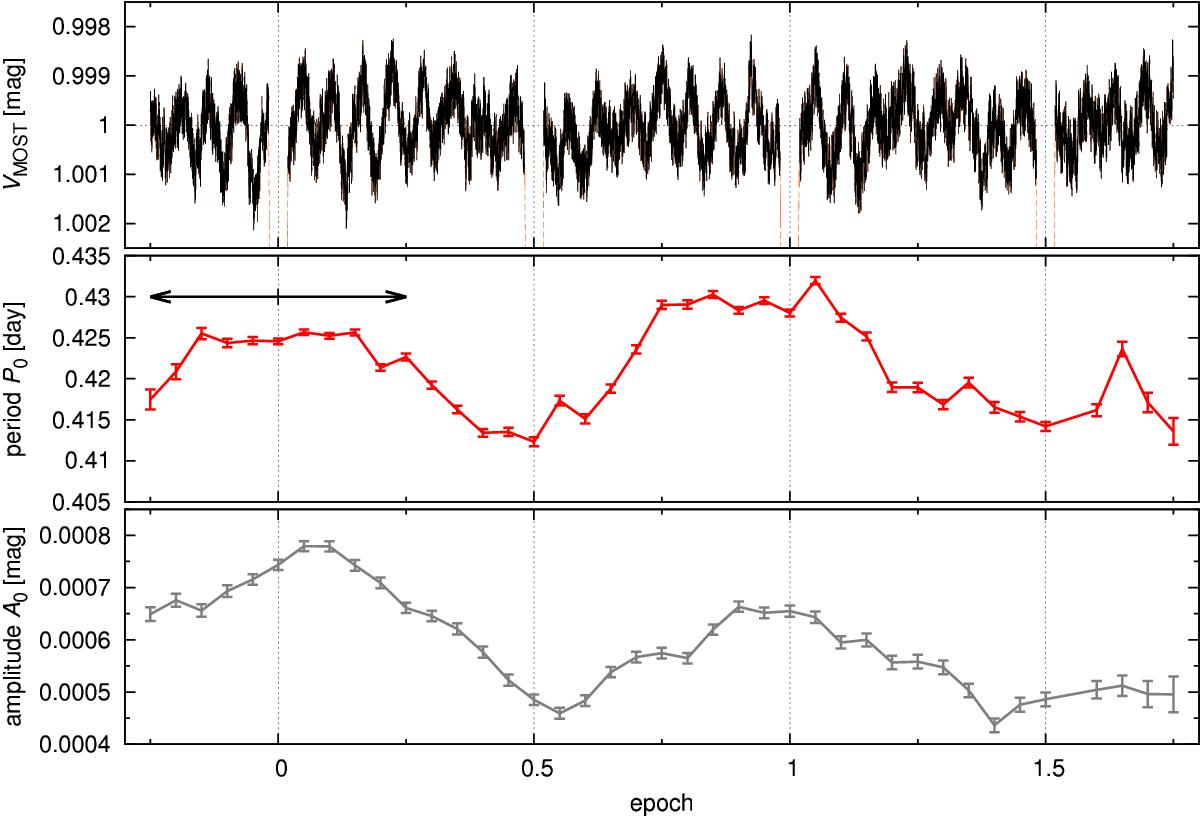
Normalised light curve as reduced from MOST photometry, but without intervals of primary and secondary eclipses (top panel), together with the corresponding period P0 (middle) and amplitude A0 (bottom) of the harmonic function f(t) = 1 + C0 + A0sin [ 2π(t−T0) /P0 + φ0 ], which was sequentially fitted to the light curve, always in limited intervals ΔE1 = 0.5 of the epoch (indicated by the black double arrow), shifted with a step ΔE2 = 0.05. The oscillations exhibit both frequency and amplitude modulations, with periods spanning P0 = (0.42 ± 0.01) d and amplitudes A0 = (0.00060 ± 0.00015) mag. It seems that the longest P0 and the largest A0 are observed at around primary eclipses and vice versa.
Current usage metrics show cumulative count of Article Views (full-text article views including HTML views, PDF and ePub downloads, according to the available data) and Abstracts Views on Vision4Press platform.
Data correspond to usage on the plateform after 2015. The current usage metrics is available 48-96 hours after online publication and is updated daily on week days.
Initial download of the metrics may take a while.