Fig. C.9
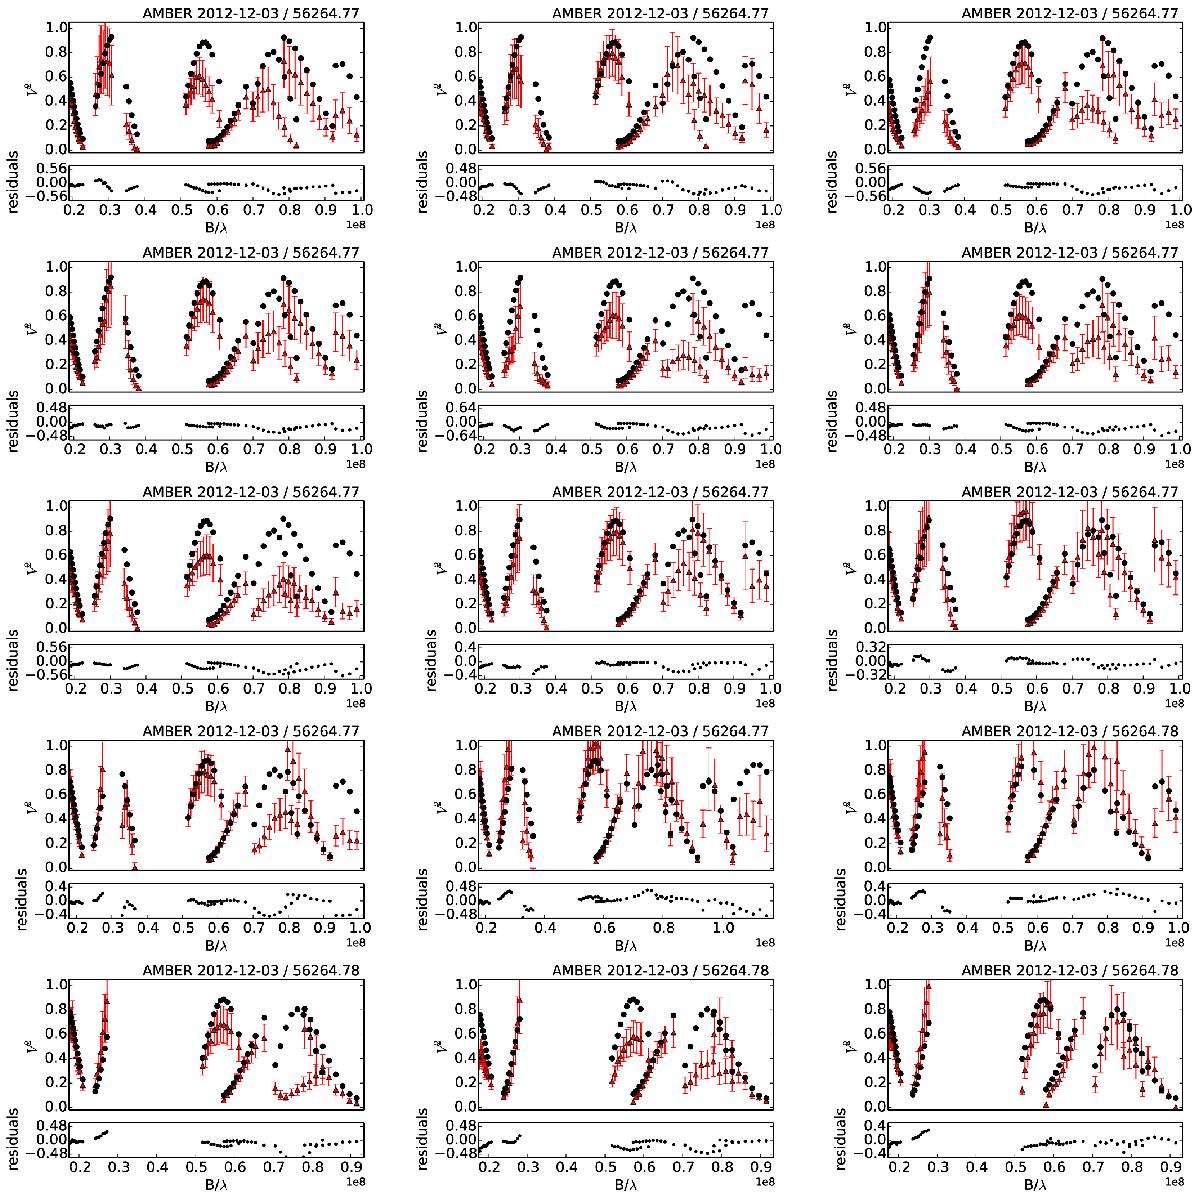
Best-fitting model (part nine) plotted against the observations from the VLTI/AMBER spectro-interferometer. In each panel, the observed squared visibility V2 is plotted with red triangles; the model corresponding to parameters listed in Table 11 is denoted with black points. Residuals of the fit are shown below each panel. The mean acquisition date, the corresponding mean reduced heliocentric Julian date, and the instrument are indicated above each panel.
Current usage metrics show cumulative count of Article Views (full-text article views including HTML views, PDF and ePub downloads, according to the available data) and Abstracts Views on Vision4Press platform.
Data correspond to usage on the plateform after 2015. The current usage metrics is available 48-96 hours after online publication and is updated daily on week days.
Initial download of the metrics may take a while.