Fig. A.1
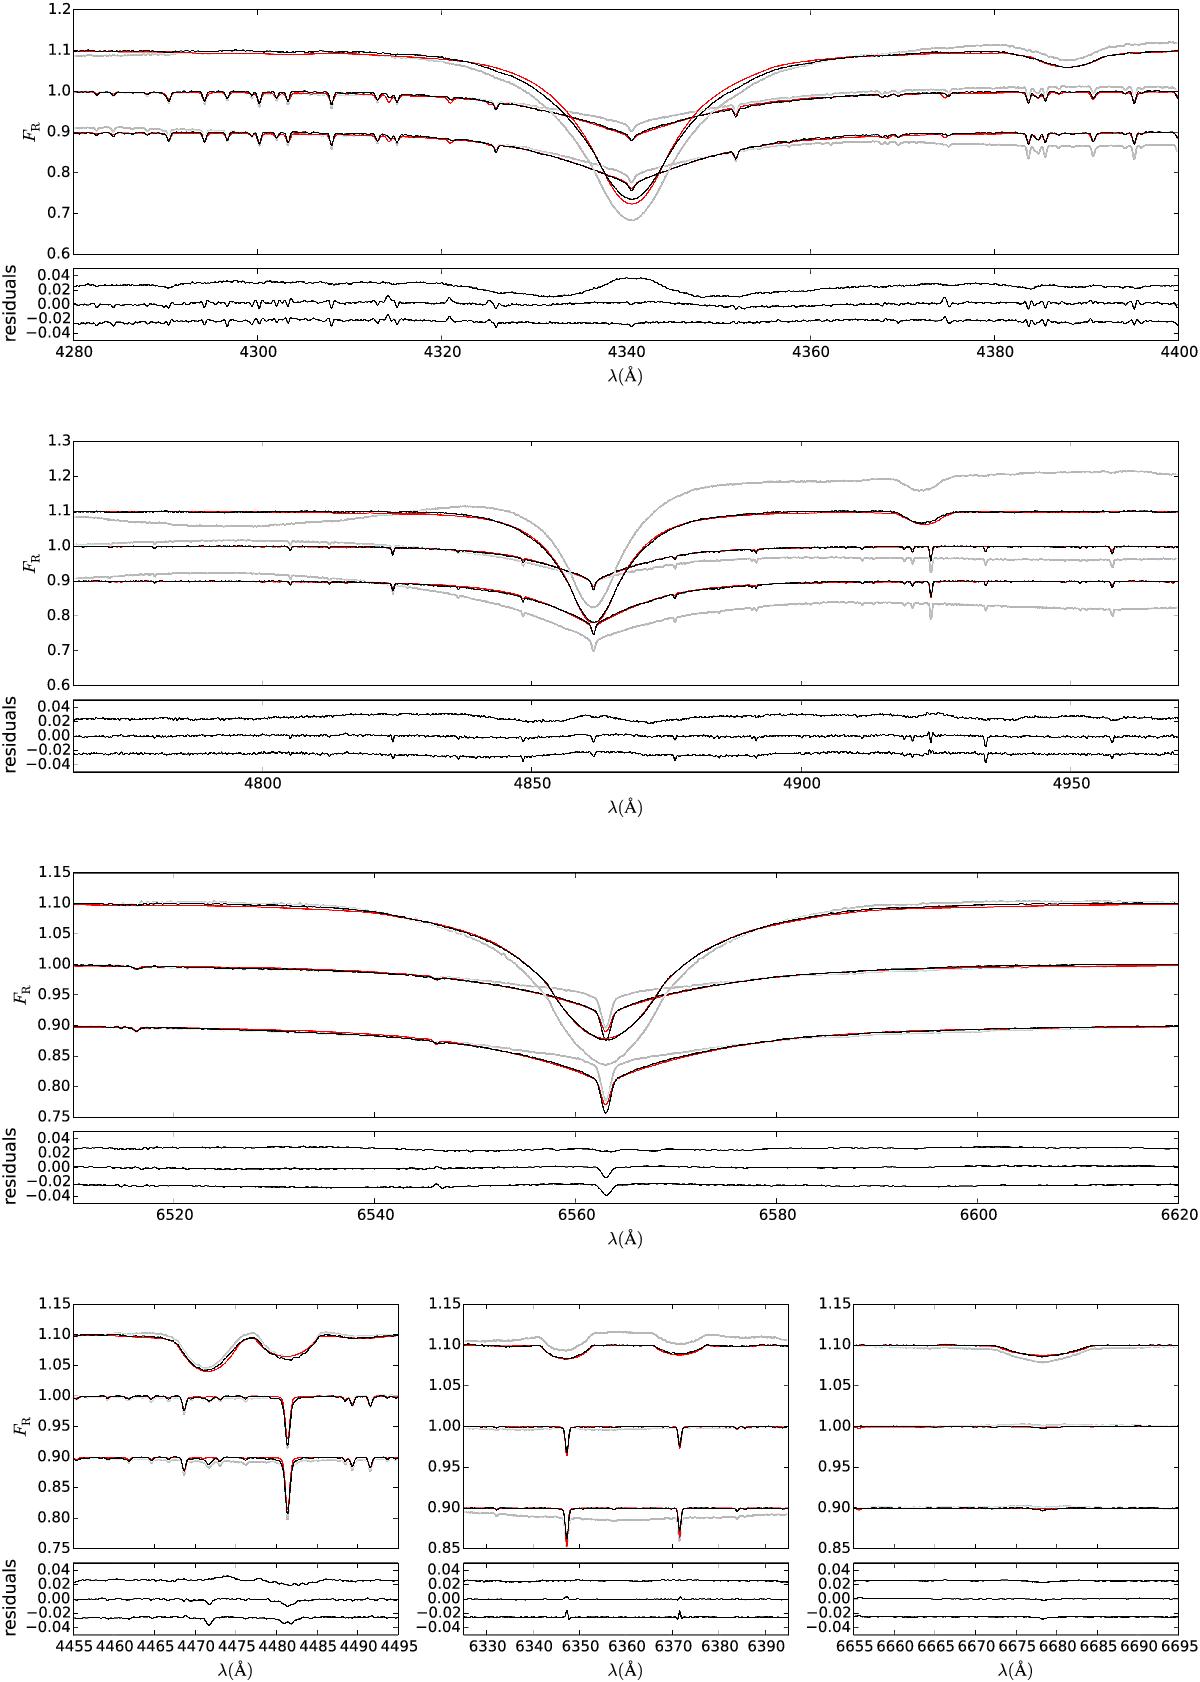
Comparison of the separated and synthetic spectra. The parameters defining the synthetic spectra are listed in Table 6. In each panel we show in the top spectrum component B, in the middle spectrum component Aa, and in the bottom spectrum component Ab. The thick grey line plots spectra, the thin black line separated and re-normalised spectra, and the thin red line synthetic spectra. The residuals are computed for synthetic and re-normalised separated spectra.
Current usage metrics show cumulative count of Article Views (full-text article views including HTML views, PDF and ePub downloads, according to the available data) and Abstracts Views on Vision4Press platform.
Data correspond to usage on the plateform after 2015. The current usage metrics is available 48-96 hours after online publication and is updated daily on week days.
Initial download of the metrics may take a while.