Fig. 13
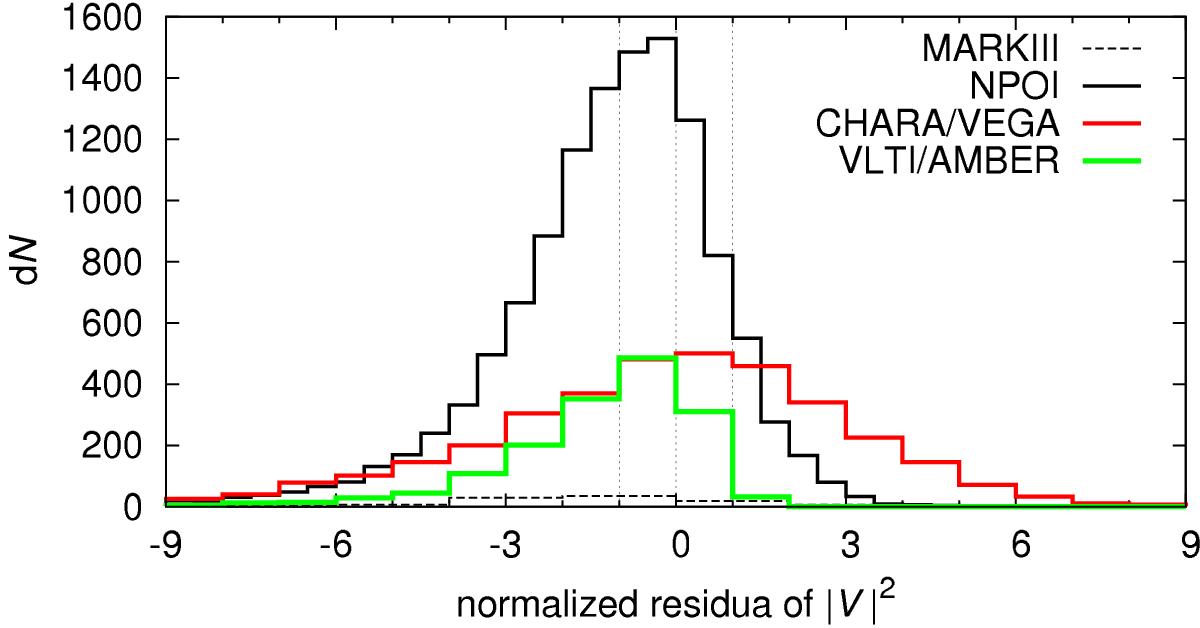
Distributions of normalised residuals (![]() of the squared visibility for our best-fit model with
of the squared visibility for our best-fit model with ![]() , while the total number of measurements is Nvis = 17 391. Four separate datasets are shown, corresponding to the MARKIII, NPOI, CHARA/VEGA, and VLTI/AMBER interferometers. The distributions are not perfectly symmetric about zero and for CHARA/VEGA data are significantly wider, probably due to unaccounted calibration uncertainties.
, while the total number of measurements is Nvis = 17 391. Four separate datasets are shown, corresponding to the MARKIII, NPOI, CHARA/VEGA, and VLTI/AMBER interferometers. The distributions are not perfectly symmetric about zero and for CHARA/VEGA data are significantly wider, probably due to unaccounted calibration uncertainties.
Current usage metrics show cumulative count of Article Views (full-text article views including HTML views, PDF and ePub downloads, according to the available data) and Abstracts Views on Vision4Press platform.
Data correspond to usage on the plateform after 2015. The current usage metrics is available 48-96 hours after online publication and is updated daily on week days.
Initial download of the metrics may take a while.