Fig. 12
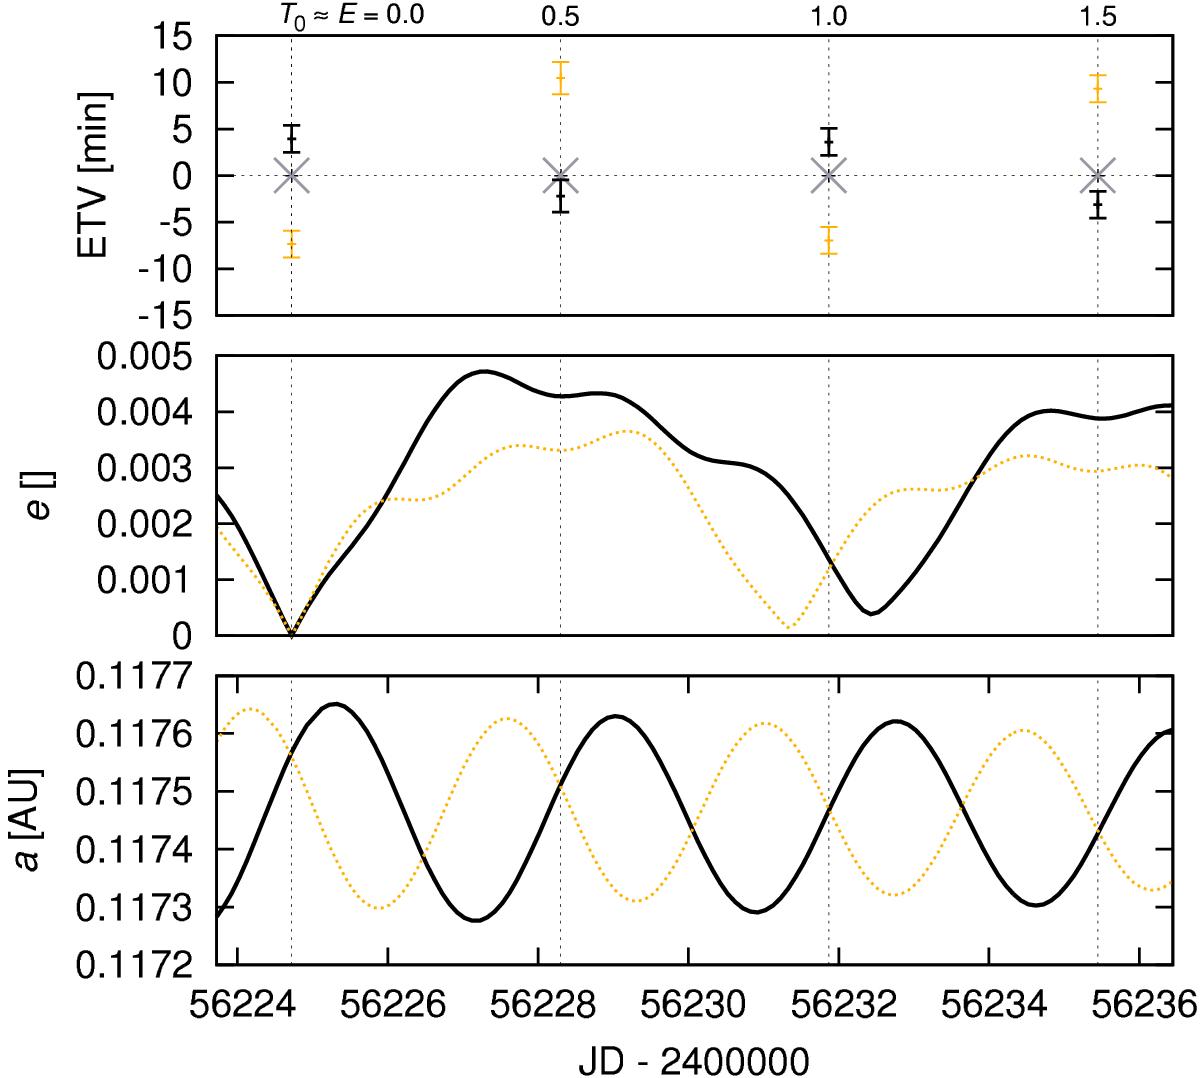
Comparison of the osculating semi-major axis a1 (bottom) and eccentricity e1 evolution (middle) as computed by our N-body model for two mirror solutions with Ω1 ≃ 331° (bold solid) and ![]() (red dashed). Only a short time span of 12 days is shown, close to the epoch T0. The corresponding ETVs of minima observed by MOST are also shown at the top. The former solution Ω1 ≃ 331° has the corresponding
(red dashed). Only a short time span of 12 days is shown, close to the epoch T0. The corresponding ETVs of minima observed by MOST are also shown at the top. The former solution Ω1 ≃ 331° has the corresponding ![]() (for all Netv = 35 measurements) significantly lower than the latter, 150 vs. 390, so that we consider it as the preferred value.
(for all Netv = 35 measurements) significantly lower than the latter, 150 vs. 390, so that we consider it as the preferred value.
Current usage metrics show cumulative count of Article Views (full-text article views including HTML views, PDF and ePub downloads, according to the available data) and Abstracts Views on Vision4Press platform.
Data correspond to usage on the plateform after 2015. The current usage metrics is available 48-96 hours after online publication and is updated daily on week days.
Initial download of the metrics may take a while.