Fig. 1
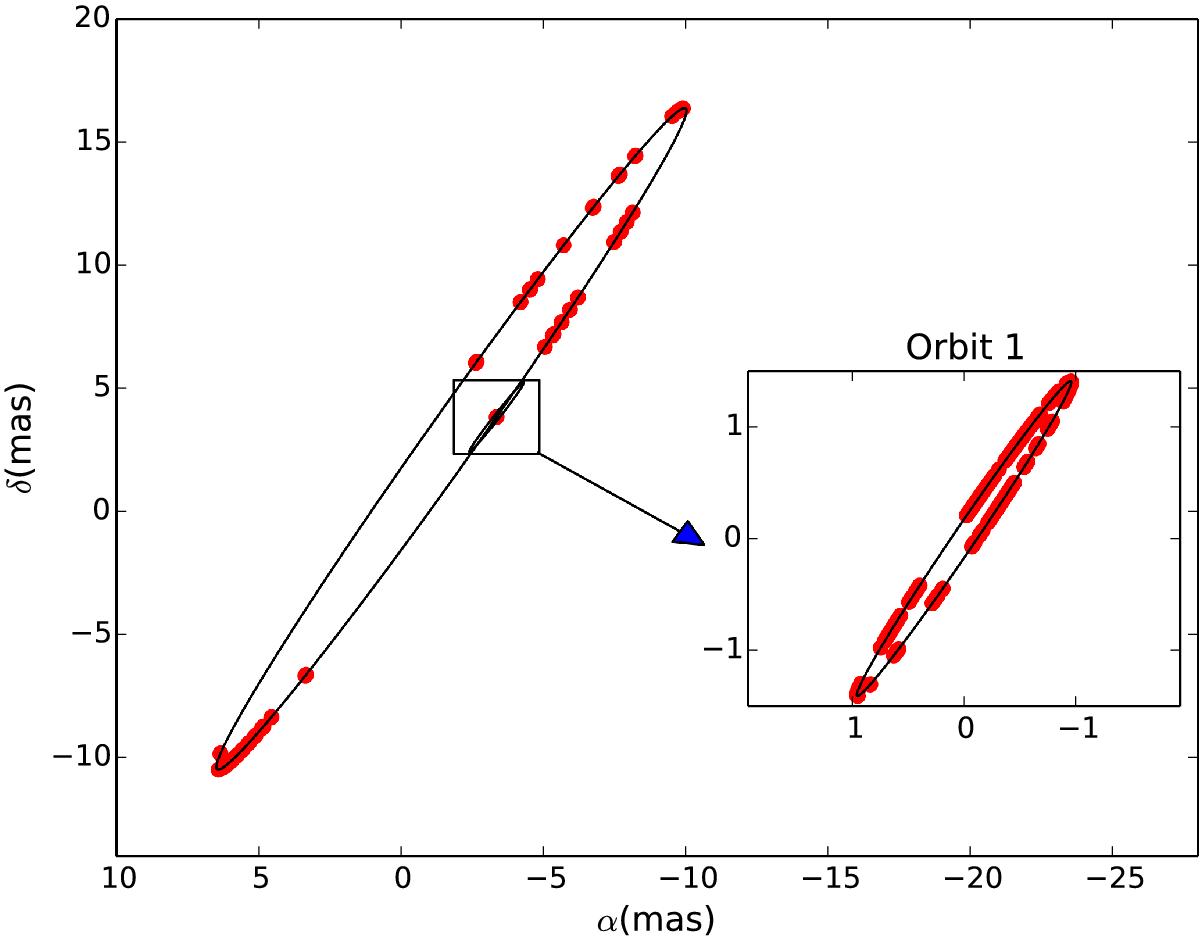
Coverage of orbits 1 and 2 with the spectro-interferometric observations. The outer plot: the black line denotes the orbit of the centre of mass of the eclipsing binary relative to component B (which resides at the beginning of the coordinate system of the outer plot), and red dots denote the relative position of the centre of mass of the eclipsing binary relative to component B at the epochs of spectro-interferometric observations. The inset plot: the black line denotes the orbit of component Ab relative to component Aa (which resides at the beginning of the coordinate system of the inset plot), and red dots denote the relative position of component Ab relative to component Aa at epochs of spectro-interferometric observations. In both plots the orbital elements are invariable, i.e. they do not show the true orbits 1 and 2 as they would appear on the sky, but only demonstrate that the spectro-interferometric observations sample the orbits well enough to constrain elements of both orbits.
Current usage metrics show cumulative count of Article Views (full-text article views including HTML views, PDF and ePub downloads, according to the available data) and Abstracts Views on Vision4Press platform.
Data correspond to usage on the plateform after 2015. The current usage metrics is available 48-96 hours after online publication and is updated daily on week days.
Initial download of the metrics may take a while.