Fig. 2
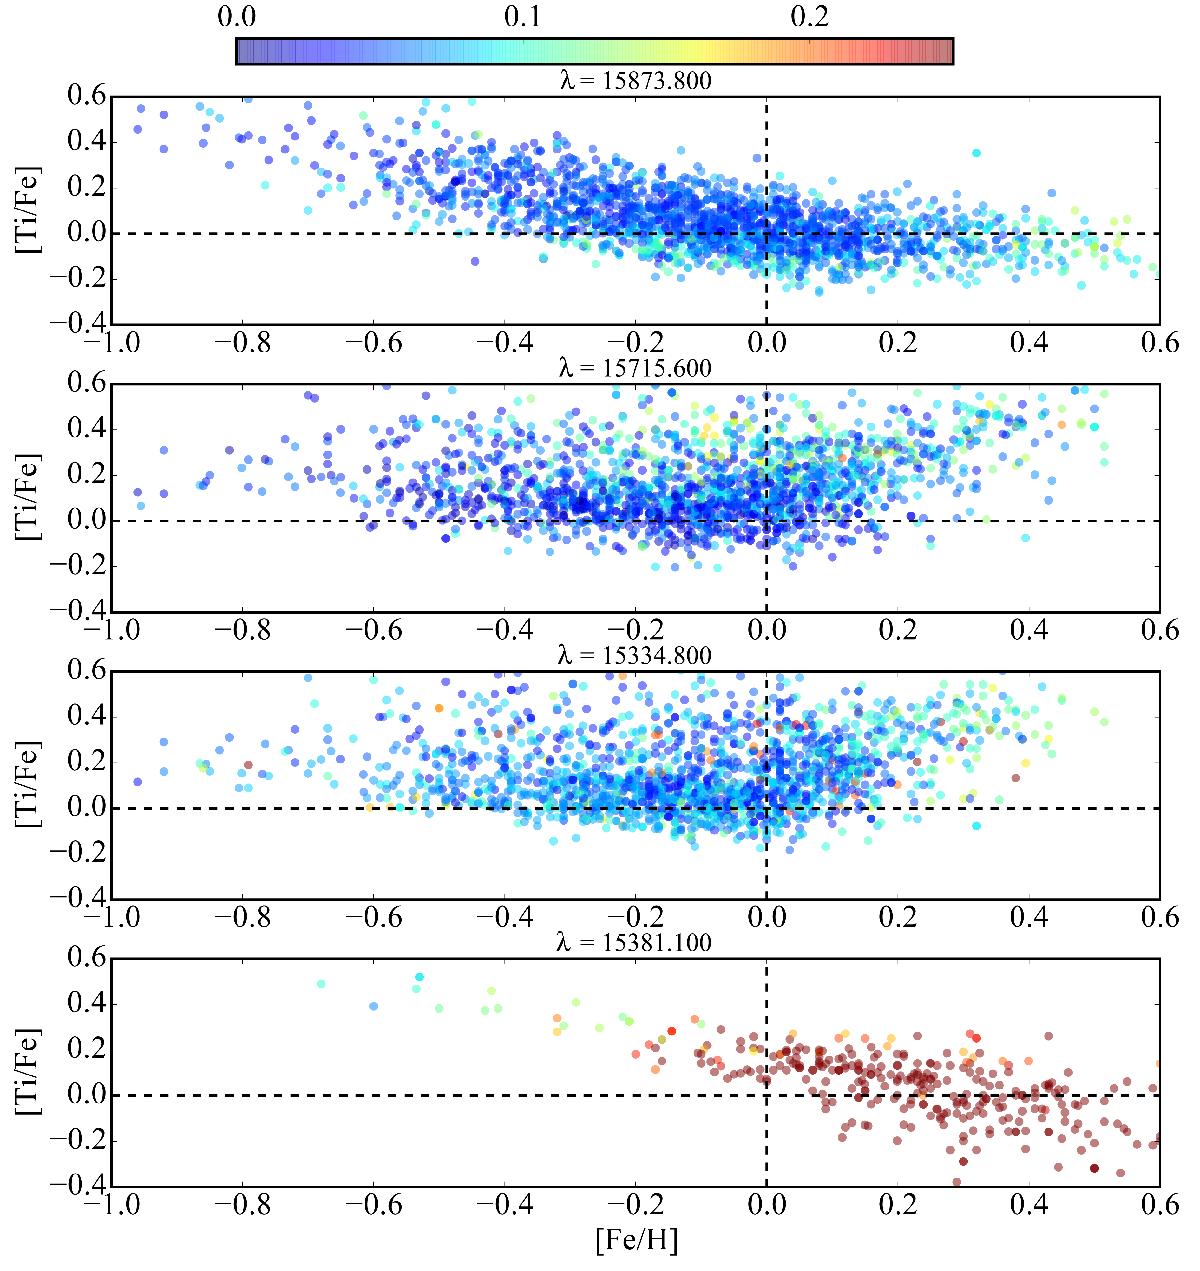
[Ti/Fe] as a function of metallicity for the full APOKASC sample for the 15 873.8 Å, 15 715.6 Å, 15 334.8 Å, and 15 381.1 Å lines from top to bottom, respectively. The stars are color-coded by the BACCHUS method-to-method dispersion, which is defined as the standard deviation of the abundance derived from the four procedures.
Current usage metrics show cumulative count of Article Views (full-text article views including HTML views, PDF and ePub downloads, according to the available data) and Abstracts Views on Vision4Press platform.
Data correspond to usage on the plateform after 2015. The current usage metrics is available 48-96 hours after online publication and is updated daily on week days.
Initial download of the metrics may take a while.