Fig. 16
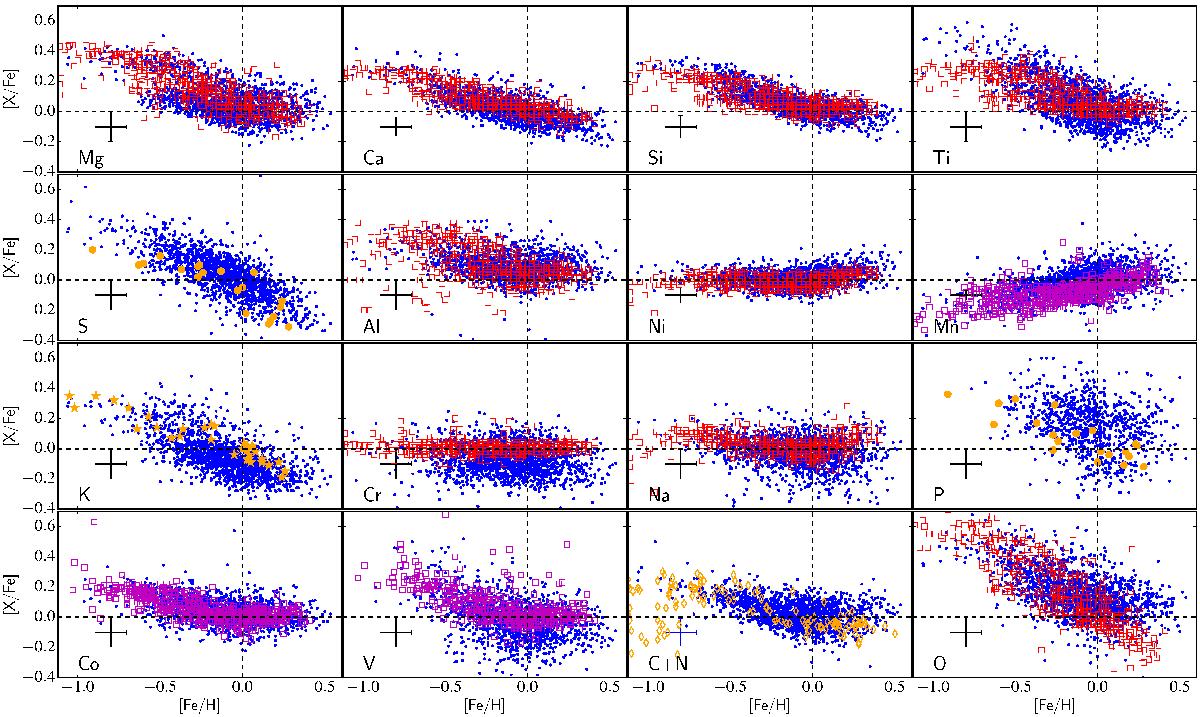
[X/Fe]–[Fe/H] diagram for each element for the APOKASC sample from the BACCHUS (blue points) and a local sample of dwarf stars observed in the optical from Bensby et al. (2014) denoted by red open squares and Battistini & Bensby (2015) denoted as open magenta squares. In addition, the [P/Fe] and [S/Fe] are taken from Caffau et al. (2011) and are denoted as orange circle. The literature [K/Fe] are sourced from Shimansky et al. (2003) and are denoted as orange stars. The literature data for the [C+N/Fe] panel is the [C/Fe] data taken from Nissen et al. (2014) and is denoted as orange open diamonds. The error bars represents the median uncertainty in [Fe/H] and [X/Fe].
Current usage metrics show cumulative count of Article Views (full-text article views including HTML views, PDF and ePub downloads, according to the available data) and Abstracts Views on Vision4Press platform.
Data correspond to usage on the plateform after 2015. The current usage metrics is available 48-96 hours after online publication and is updated daily on week days.
Initial download of the metrics may take a while.