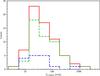
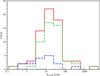
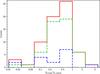
Fig. 3
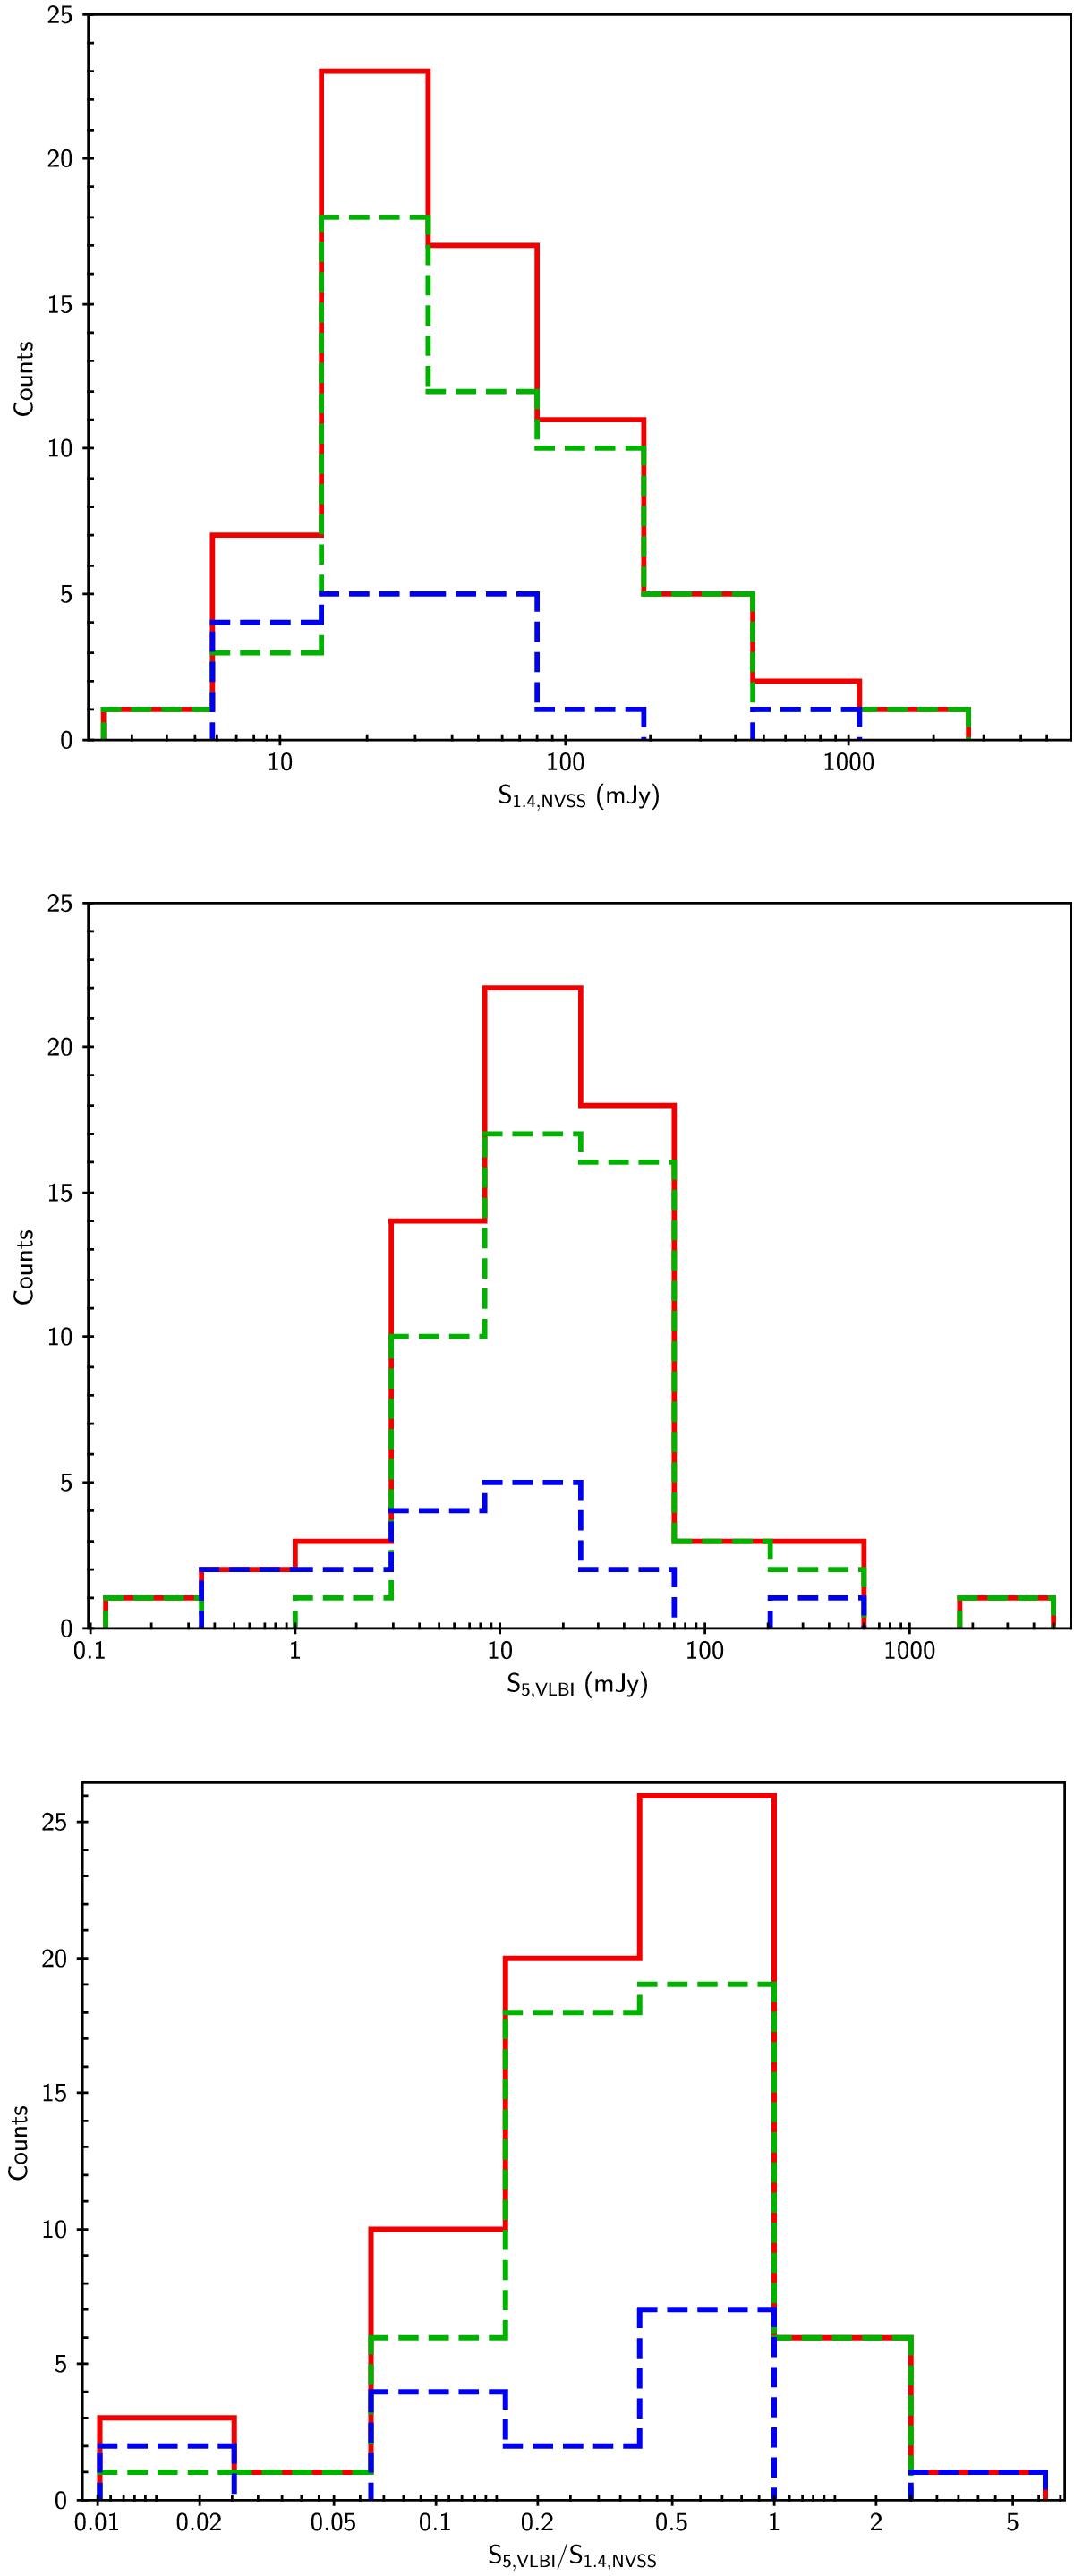
Flux density distribution for the detected sources. Top panel: 1.4 GHz NVSS flux density distribution; middle panel: 5 GHz VLBA flux density distribution; bottom panel: distribution of the ratio between the 5 GHz VLBA and the 1.4 GHz NVSS flux densities. Solid red line: All sources; green dashed line: Blazars; blue dashed line: UGS.
Current usage metrics show cumulative count of Article Views (full-text article views including HTML views, PDF and ePub downloads, according to the available data) and Abstracts Views on Vision4Press platform.
Data correspond to usage on the plateform after 2015. The current usage metrics is available 48-96 hours after online publication and is updated daily on week days.
Initial download of the metrics may take a while.