Fig. 8
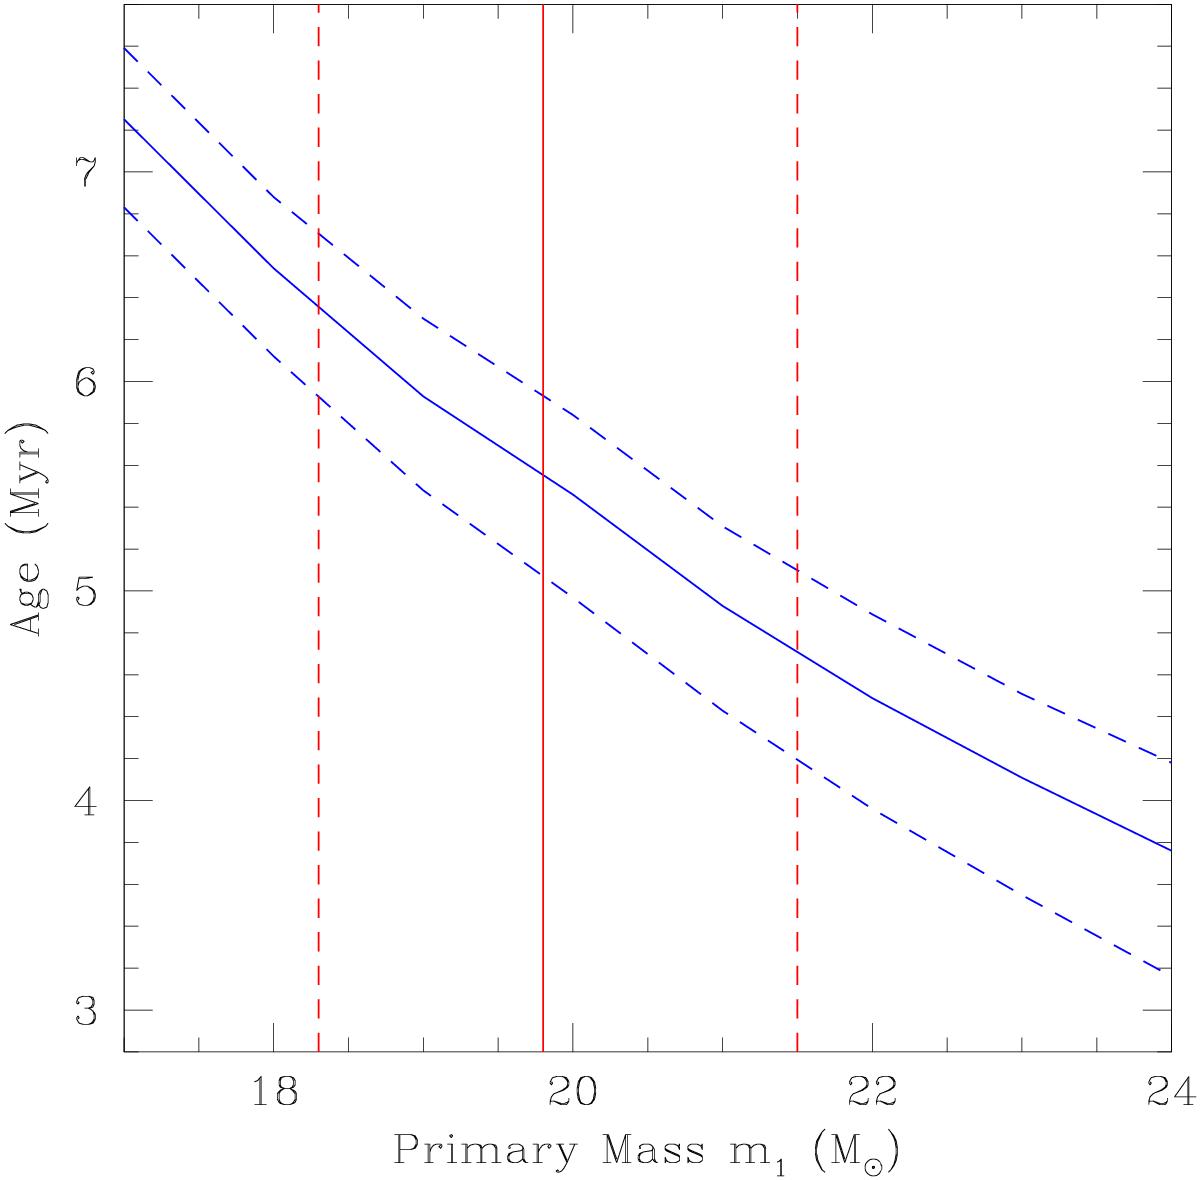
Relation between the age of HD 152218 and the mass of the primary star. The blue solid curve corresponds to the combination of age and primary mass in our CLES models (assuming Z = 0.014 and α = 0.0) that reproduce exactly the observed rate of apsidal motion through Eq. (11). The blue dashed curves correspond to the 1σ errors on the observed ![]() . The red vertical lines correspond to the absolute mass of the primary determined from our orbital and photometric solution (Table 3) and its errors.
. The red vertical lines correspond to the absolute mass of the primary determined from our orbital and photometric solution (Table 3) and its errors.
Current usage metrics show cumulative count of Article Views (full-text article views including HTML views, PDF and ePub downloads, according to the available data) and Abstracts Views on Vision4Press platform.
Data correspond to usage on the plateform after 2015. The current usage metrics is available 48-96 hours after online publication and is updated daily on week days.
Initial download of the metrics may take a while.