Fig. 7
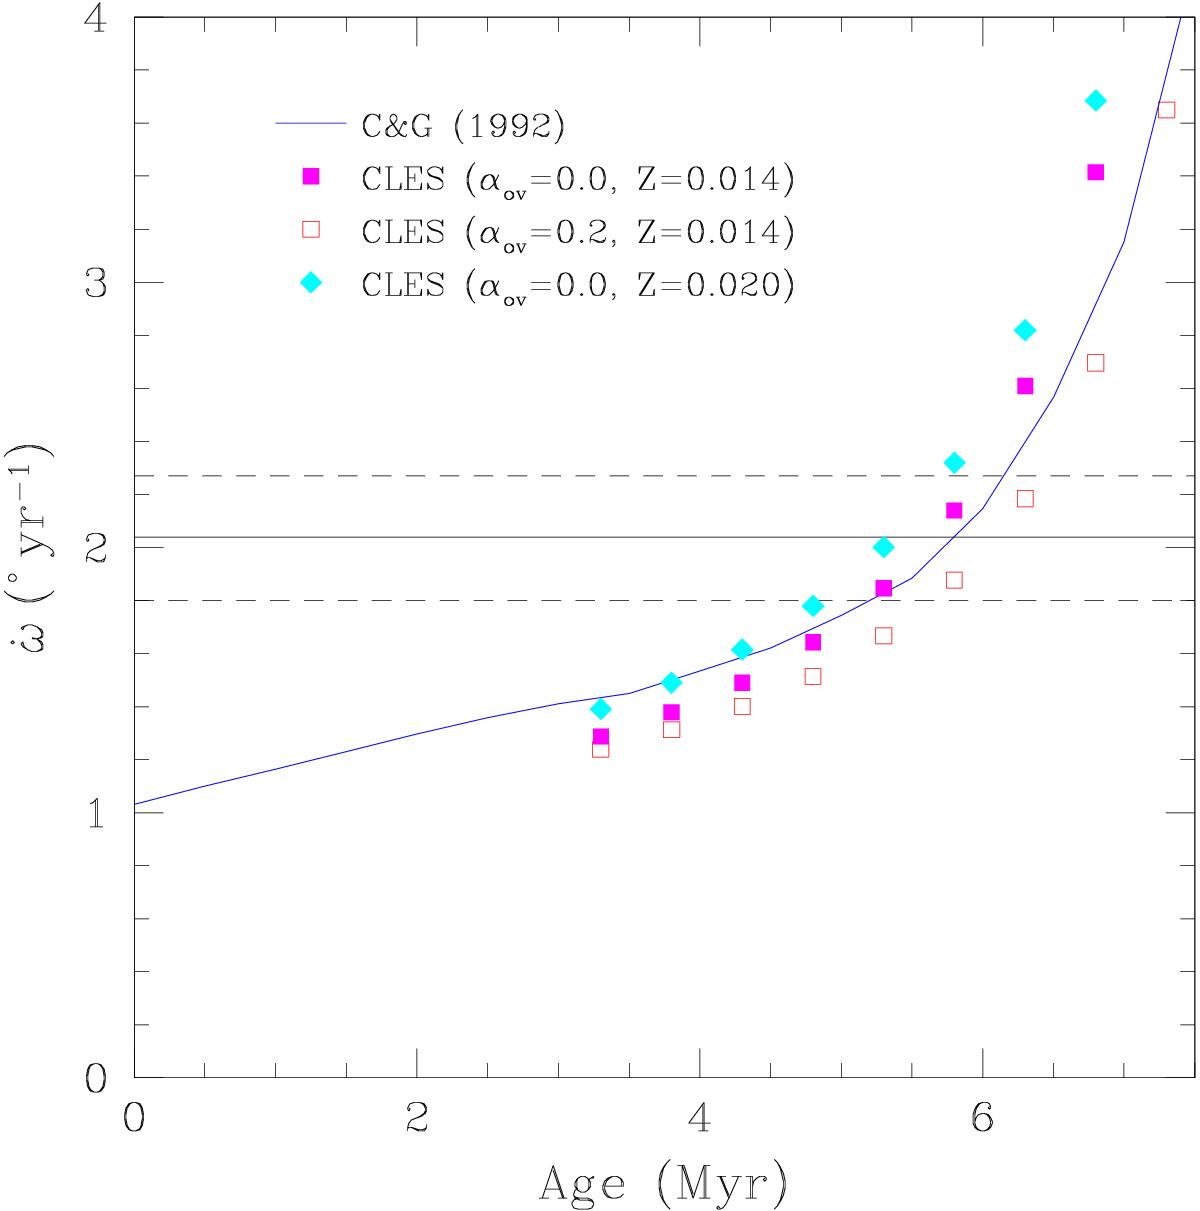
Comparison between the observed value of ![]() (solid horizontal line) with its errors (dashed horizontal lines) and the values evaluated from stellar structure models as a function of stellar age. The solid curve yields the results obtained by interpolating the models of Claret & Giménez (1992). The filled squares correspond to the results obtained through the resolution of the Clairaut-Radau equation applied to the CLES models for a 20 M⊙ primary and a 15 M⊙ secondary. The open squares yield the results for CLES models assuming an overshooting with αov = 0.2. The filled diamonds stand for the CLES models with a slightly higher metallicity.
(solid horizontal line) with its errors (dashed horizontal lines) and the values evaluated from stellar structure models as a function of stellar age. The solid curve yields the results obtained by interpolating the models of Claret & Giménez (1992). The filled squares correspond to the results obtained through the resolution of the Clairaut-Radau equation applied to the CLES models for a 20 M⊙ primary and a 15 M⊙ secondary. The open squares yield the results for CLES models assuming an overshooting with αov = 0.2. The filled diamonds stand for the CLES models with a slightly higher metallicity.
Current usage metrics show cumulative count of Article Views (full-text article views including HTML views, PDF and ePub downloads, according to the available data) and Abstracts Views on Vision4Press platform.
Data correspond to usage on the plateform after 2015. The current usage metrics is available 48-96 hours after online publication and is updated daily on week days.
Initial download of the metrics may take a while.