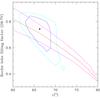
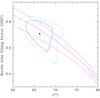
Fig. 6
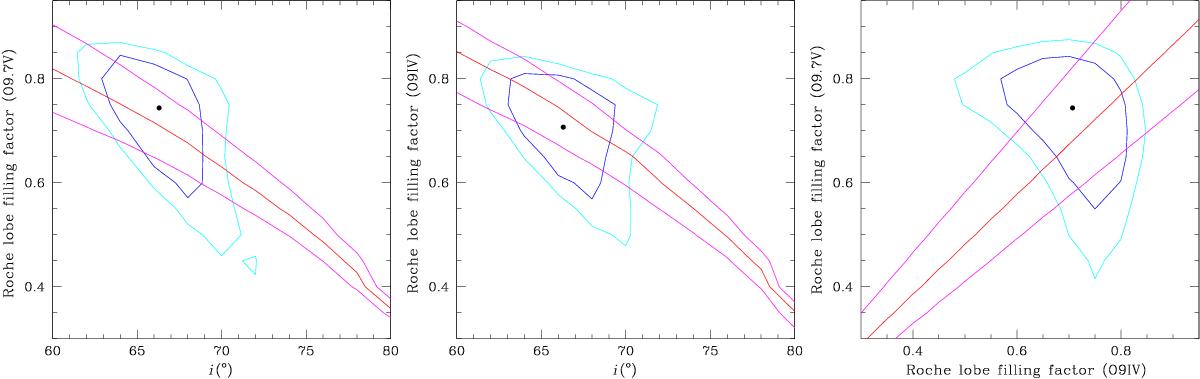
Contours of 1σ (blue) and 90% confidence intervals (cyan) in the various parameter spaces of the light curve analysis. The red curve corresponds to a ratio of the filling factors of 1.04 (see text), whilst the magenta curves yield the corresponding 1σ interval, as derived from spectroscopy. The filled dot indicates the set of parameters that yields the best fit of the ASAS light curve.
Current usage metrics show cumulative count of Article Views (full-text article views including HTML views, PDF and ePub downloads, according to the available data) and Abstracts Views on Vision4Press platform.
Data correspond to usage on the plateform after 2015. The current usage metrics is available 48-96 hours after online publication and is updated daily on week days.
Initial download of the metrics may take a while.