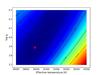
Fig. 3
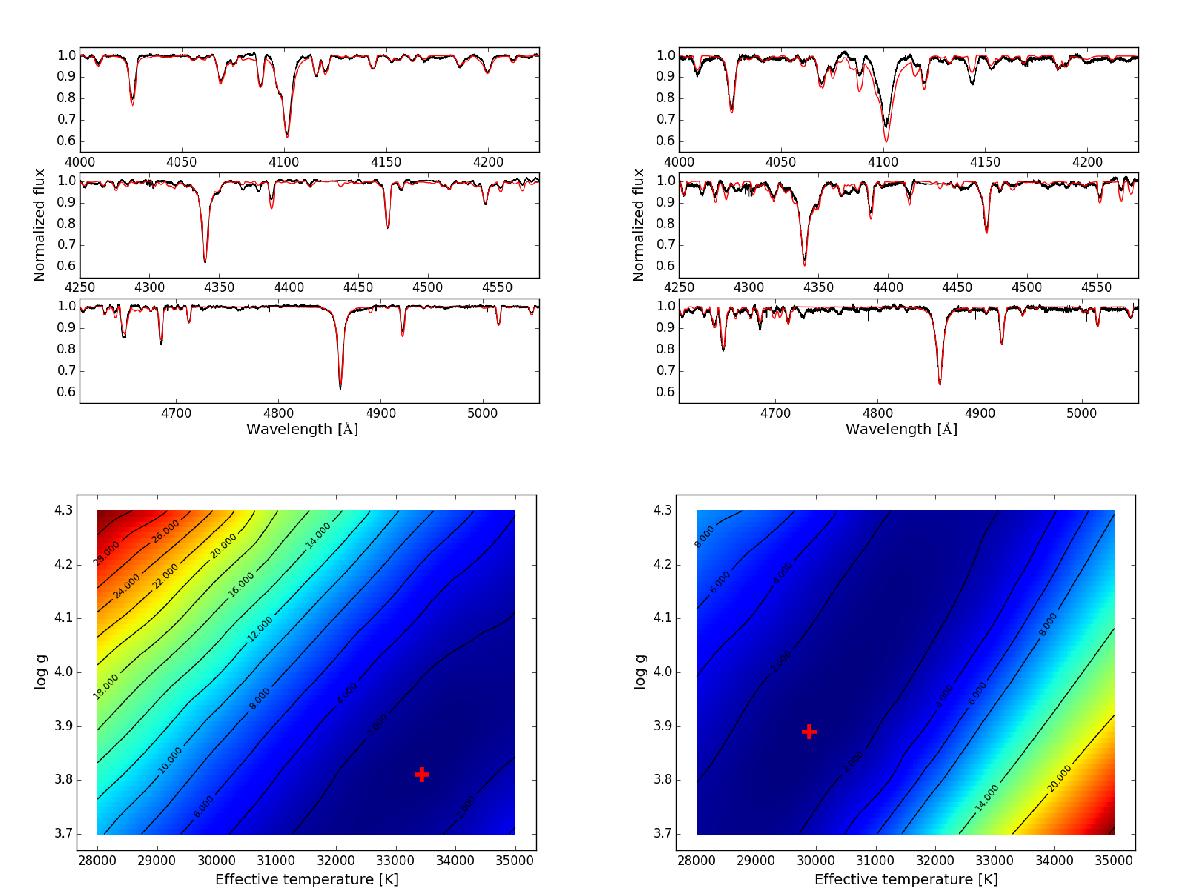
Top row: comparison between the primary (left) and secondary (right) spectra obtained with the disentangling process (black lines) and the best-fit CMFGEN models (red lines). Bottom row: χ2 map of the CMFGEN fits showing the errors on our best-fit temperatures and gravities (shown by the red crosses) for the primary (left) and secondary (right).
Current usage metrics show cumulative count of Article Views (full-text article views including HTML views, PDF and ePub downloads, according to the available data) and Abstracts Views on Vision4Press platform.
Data correspond to usage on the plateform after 2015. The current usage metrics is available 48-96 hours after online publication and is updated daily on week days.
Initial download of the metrics may take a while.