Free Access
Fig. 8
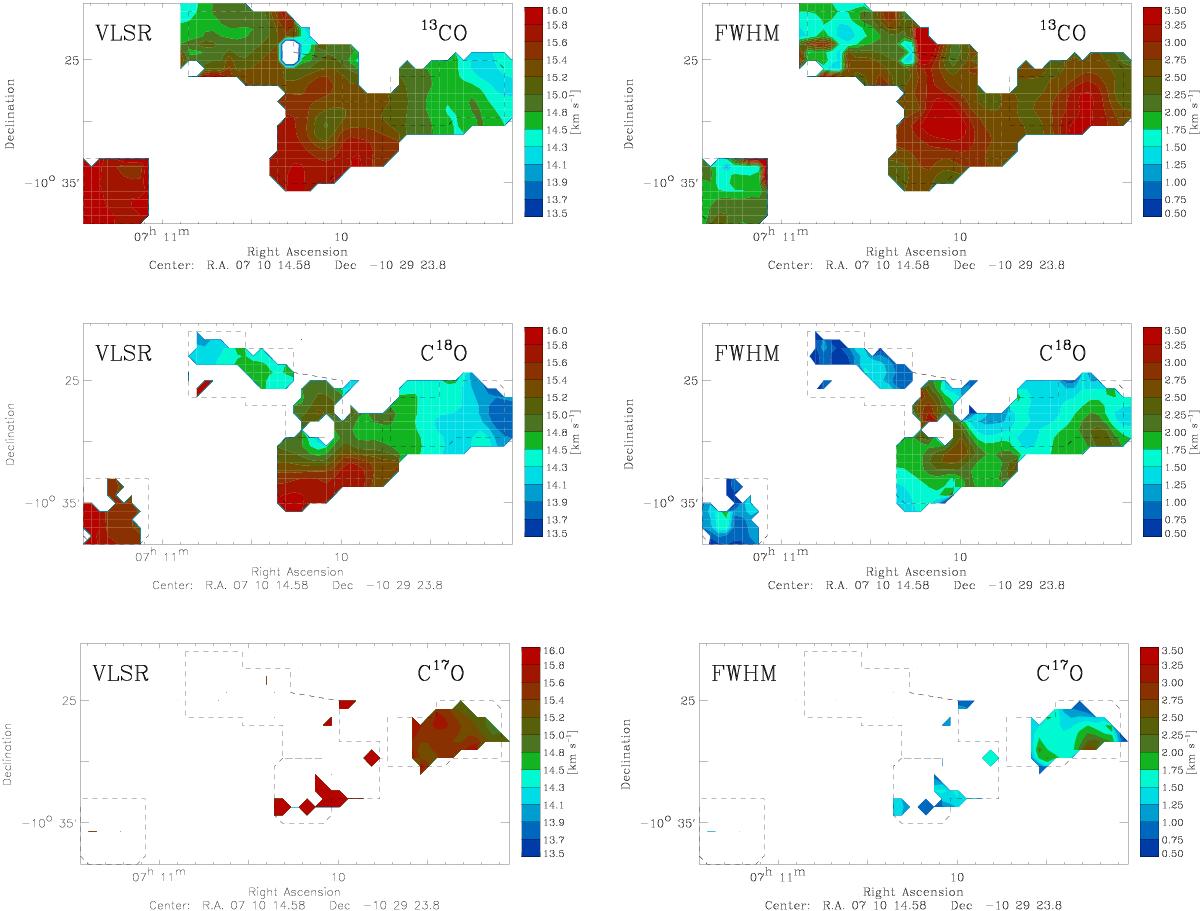
Line center velocities (left column) and line widths (right column) after convolving (from top to bottom) the 13CO, C18O and C17O(1−0) Mopra maps to 80′′ and regridding with a 40′′ spacing. The smaller red areas are map artifacts.
This figure is made of several images, please see below:
Current usage metrics show cumulative count of Article Views (full-text article views including HTML views, PDF and ePub downloads, according to the available data) and Abstracts Views on Vision4Press platform.
Data correspond to usage on the plateform after 2015. The current usage metrics is available 48-96 hours after online publication and is updated daily on week days.
Initial download of the metrics may take a while.