Fig. 6
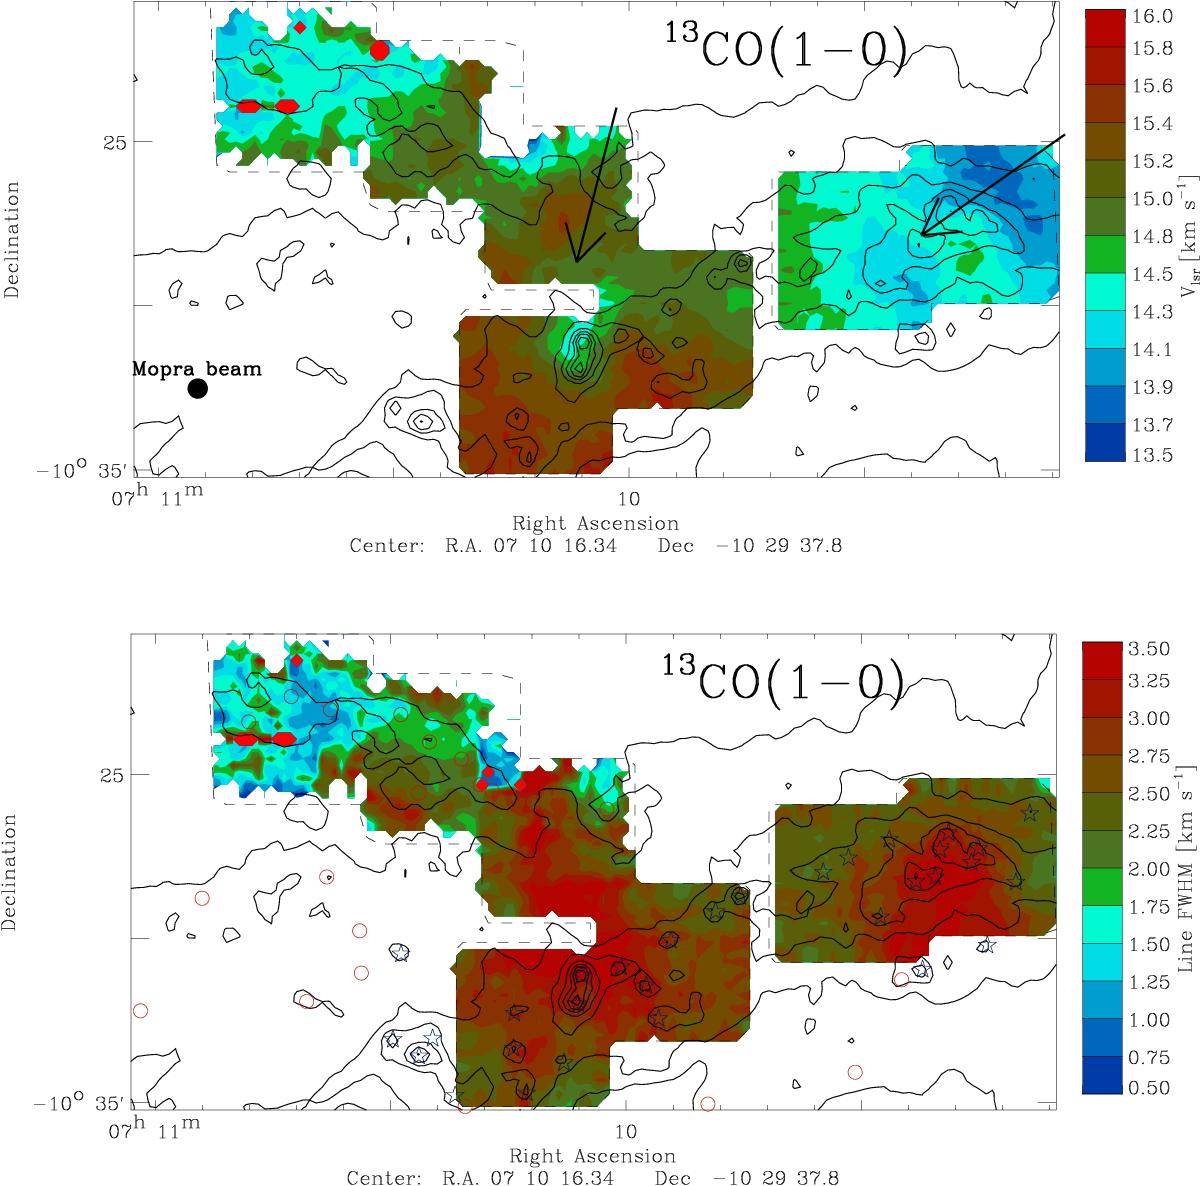
Kinematics toward the ℓ = 224° region. The top panel shows the line center velocity from the 13CO(1−0) data, while the bottom panel shows the line width. The black arrows represent the direction and relative magnitude of the velocity gradients along the main and secondary filaments (see Sect. 4.2.1), while the black filled circle at the bottom left (top panel) indicates the Mopra beam FWHM. Symbols in the lower panel are as in Fig. 1. The overlaid contours of the SPIRE 250 μm emission are as in Fig. 5. The line centers and line widths have been computed by fitting a 1- or 2-component Gaussian to the spectrum at each point (see text).
Current usage metrics show cumulative count of Article Views (full-text article views including HTML views, PDF and ePub downloads, according to the available data) and Abstracts Views on Vision4Press platform.
Data correspond to usage on the plateform after 2015. The current usage metrics is available 48-96 hours after online publication and is updated daily on week days.
Initial download of the metrics may take a while.