Fig. 4
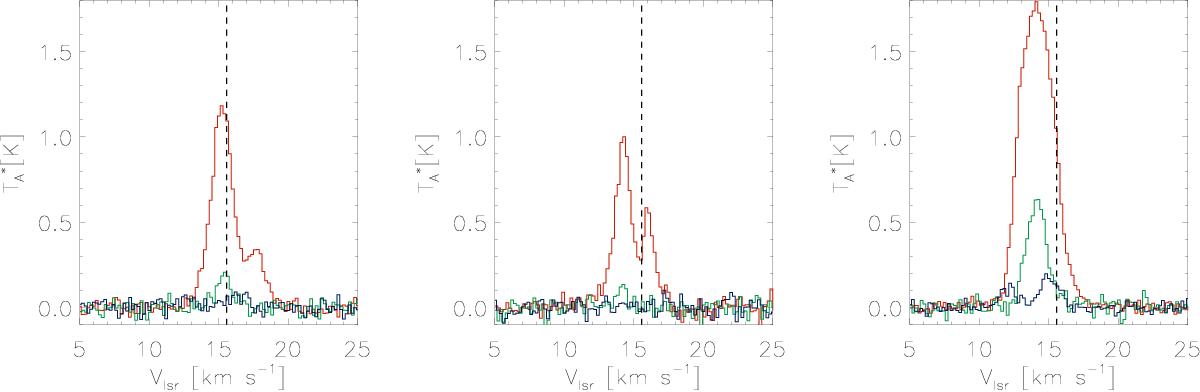
Positionally averaged spectra of 13CO (red), C18O (green) and C17O(1−0) (blue) lines. The regions considered (from left to right) are: a ~ 4 × 4 arcmin2 region around positions (RA ~07h11m18s, Dec ~− 10°36′; corresponding to the isolated individual region in the SE); a ~ 4 × 2 arcmin2 region around position (RA ~07h10m42s, Dec ~− 10°23′), at the NE end of the secondary filament; and a ~ 8 × 3 arcmin2 region around the bright region of emission toward the NW along the main filament. These last two regions are shown as black boxes in Fig. 2. The dashed vertical line corresponds to the velocity, 15.6 km s-1 obtained with a Gaussian fit to the C18O(1−0) line of the first region.
Current usage metrics show cumulative count of Article Views (full-text article views including HTML views, PDF and ePub downloads, according to the available data) and Abstracts Views on Vision4Press platform.
Data correspond to usage on the plateform after 2015. The current usage metrics is available 48-96 hours after online publication and is updated daily on week days.
Initial download of the metrics may take a while.