Fig. 3
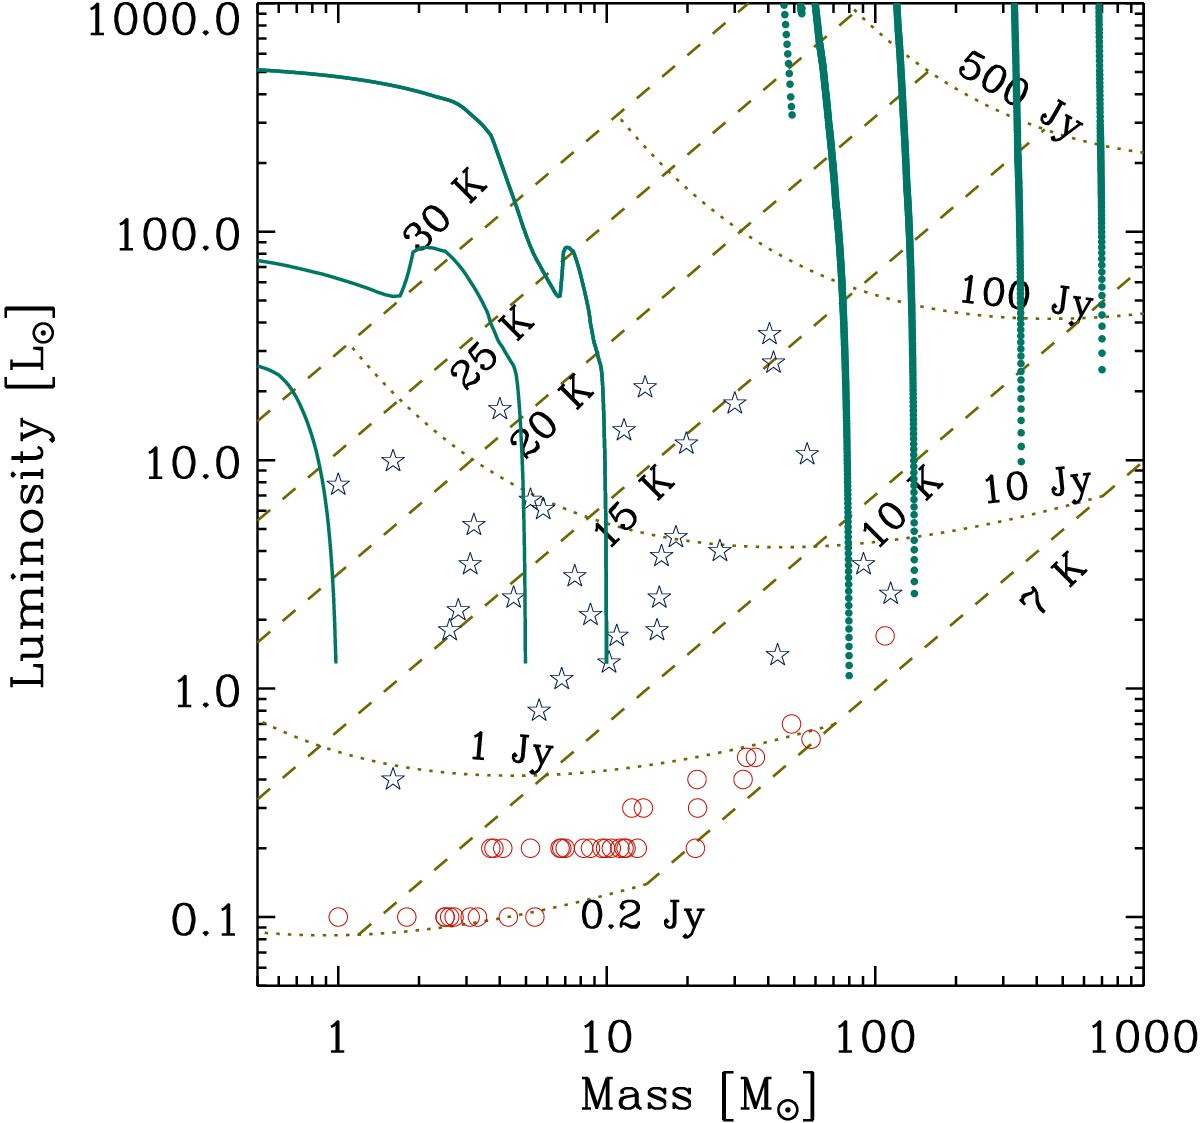
Clump bolometric luminosity vs. mass, as derived from the Hi-GAL observations. Symbols for starless and protostellar sources are as in Fig. 1. The dotted lines represent loci of constant 250μm flux density, ranging from 0.1 to 500 Jy, assuming a modified blackbody spectral energy distribution with β = 1.5 and a fixed distance of ~ 1 kpc. Roughly orthogonal to these are loci (dashed lines) at constant temperature, for the same modified blackbody. The green solid lines and small green filled circles represent the evolutionary tracks for the low- and high-mass regimes, respectively, taken from Molinari et al. (2008).
Current usage metrics show cumulative count of Article Views (full-text article views including HTML views, PDF and ePub downloads, according to the available data) and Abstracts Views on Vision4Press platform.
Data correspond to usage on the plateform after 2015. The current usage metrics is available 48-96 hours after online publication and is updated daily on week days.
Initial download of the metrics may take a while.