Fig. 2
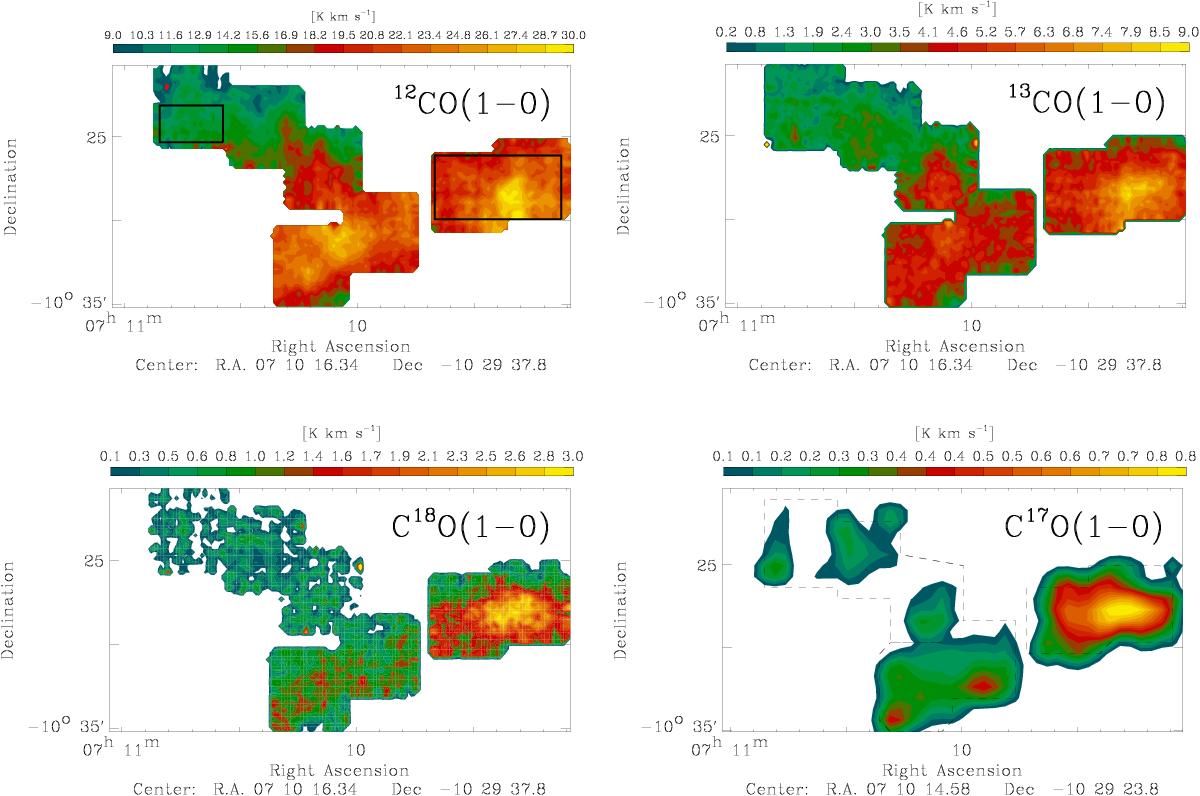
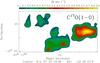
Maps of the line integrated intensity, ![]() , observed toward the ℓ = 224° region in the various CO isotopologues. From left to right and from top to bottom: 12CO(1−0), 13CO(1−0), C18O(1−0) and C17O(1−0). The map of C17O(1−0) has been convolved to an 80′′ beam and regridded to a 40′′ spacing to increase the S/N. The black boxes represent two of the regions where spectra have been averaged and shown in Fig. 4.
, observed toward the ℓ = 224° region in the various CO isotopologues. From left to right and from top to bottom: 12CO(1−0), 13CO(1−0), C18O(1−0) and C17O(1−0). The map of C17O(1−0) has been convolved to an 80′′ beam and regridded to a 40′′ spacing to increase the S/N. The black boxes represent two of the regions where spectra have been averaged and shown in Fig. 4.
Current usage metrics show cumulative count of Article Views (full-text article views including HTML views, PDF and ePub downloads, according to the available data) and Abstracts Views on Vision4Press platform.
Data correspond to usage on the plateform after 2015. The current usage metrics is available 48-96 hours after online publication and is updated daily on week days.
Initial download of the metrics may take a while.