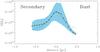
Fig. 11
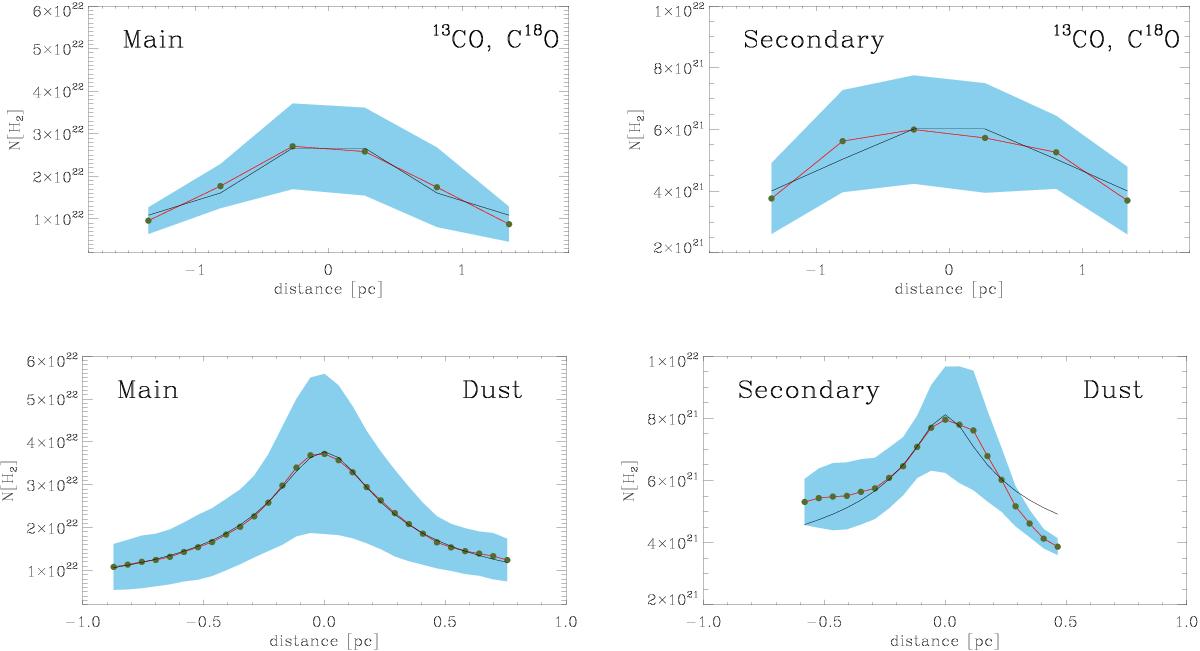
Radial column density profile of the main (left column) and secondary (right column) filaments. The dots, connected by the red solid line, show the mean profile across the filaments, while the shaded area indicates the standard deviation. In the top row the average profiles were estimated from the 13CO and C18O(1−0) derived column density (Fig. 5, top panel), while in the bottom row we used the column density estimated by Elia et al. (2013). The black solid line represents the best fit profile, following the formulation in Arzoumanian et al. (2011).
Current usage metrics show cumulative count of Article Views (full-text article views including HTML views, PDF and ePub downloads, according to the available data) and Abstracts Views on Vision4Press platform.
Data correspond to usage on the plateform after 2015. The current usage metrics is available 48-96 hours after online publication and is updated daily on week days.
Initial download of the metrics may take a while.