Fig. 1
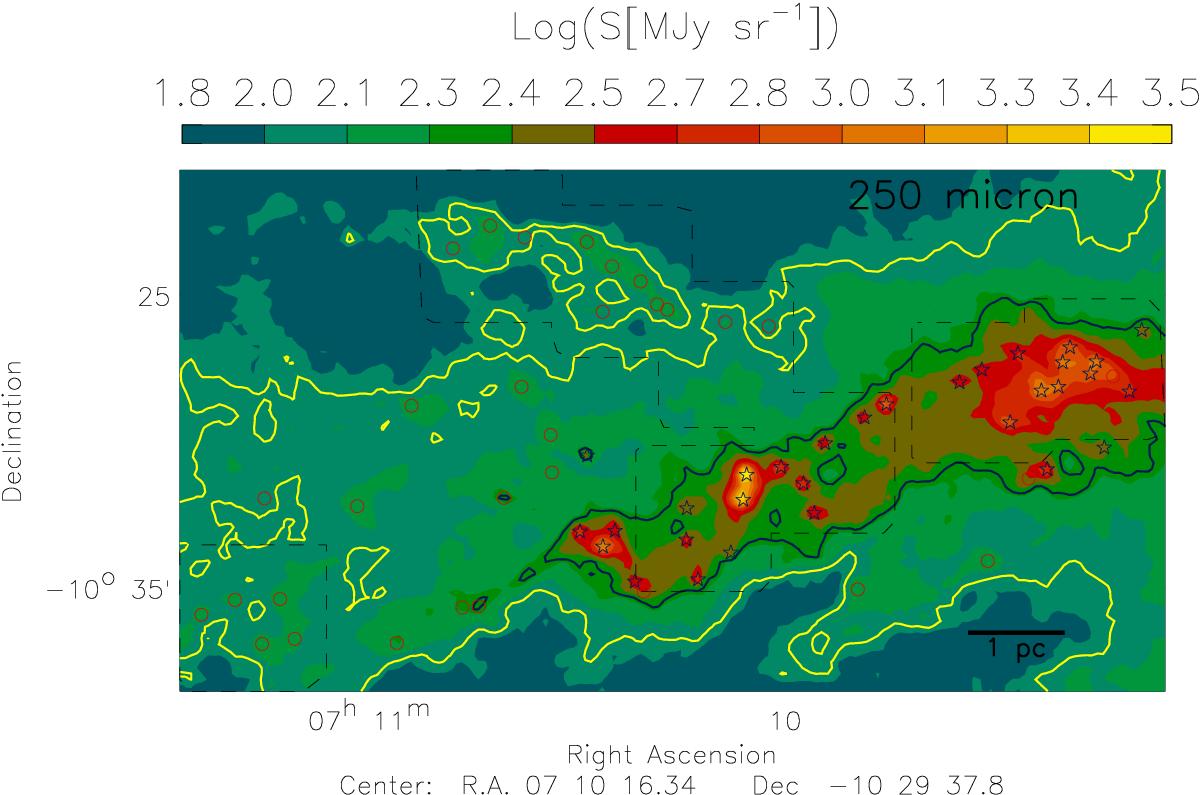
SPIRE 250 μm emission observed toward the ℓ = 224° region, with a (logarithmic) color-scale in MJy sr-1 (Elia et al. 2013). Blue star symbols represent protostellar clumps while the red empty circles represent starless clumps. The dashed, black contour shows the region mapped with the Mopra telescope. The yellow and blue solid contours correspond to about 100 and 200 MJy sr-1, respectively, and approximately trace the secondary filament toward the north (besides to low-level emission from the main filament) and the main filament.
Current usage metrics show cumulative count of Article Views (full-text article views including HTML views, PDF and ePub downloads, according to the available data) and Abstracts Views on Vision4Press platform.
Data correspond to usage on the plateform after 2015. The current usage metrics is available 48-96 hours after online publication and is updated daily on week days.
Initial download of the metrics may take a while.