Free Access
Fig. 7
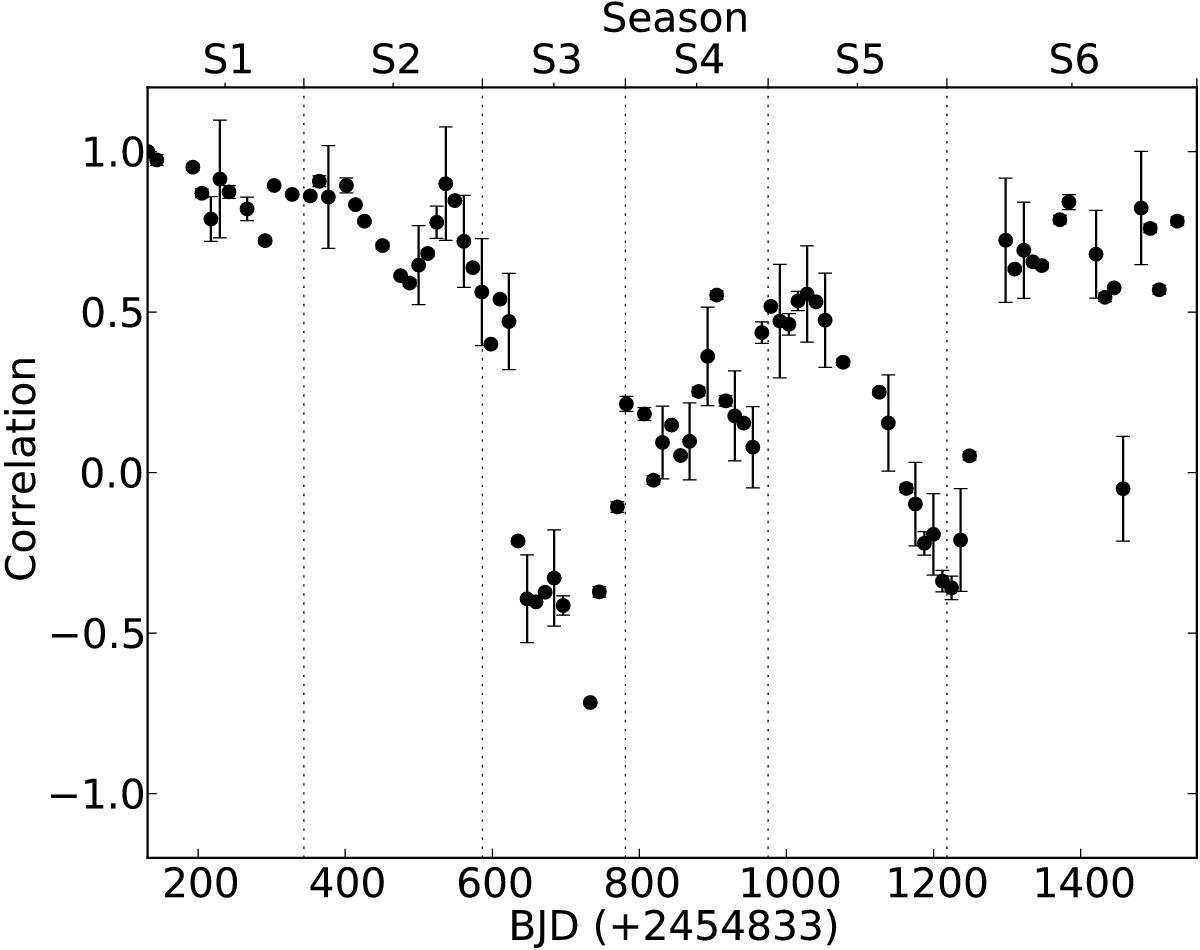
Cross-correlation between the different phases with period P = 12.28 days. The outlying points in times ~750 days and ~1450 days originate to anomalies in the light curve due to the transition from one Kepler observation quarter to the next.
Current usage metrics show cumulative count of Article Views (full-text article views including HTML views, PDF and ePub downloads, according to the available data) and Abstracts Views on Vision4Press platform.
Data correspond to usage on the plateform after 2015. The current usage metrics is available 48-96 hours after online publication and is updated daily on week days.
Initial download of the metrics may take a while.